Research Article
Rapid and Sensitive Detection of P53 Based on DNA- Protein Binding Interactions Using Silver Nanoparticle Films and Microwave Heating
Muzaffer Mohammed, Kadir Aslan *
Morgan State University, Department of Chemistry, 1700 East Cold Spring Lane, Baltimore MD 21251
* Corresponding author. E-mail: Kadir.Aslan@morgan.edu
Received: Sept. 19, 2014; Accepted: Oct. 31, 2014; Published: Nov. 10, 2014.
Citation: Muzaffer Mohammed and Kadir Aslan. Rapid and Sensitive Detection of p53 Based on DNA-Protein Binding Interactions Using Silver Nanoparticle Films and Microwave Heating. Nano Biomed. Eng. 2014, 6(3), 76-84.
DOI: 10.5101/nbe.v6i3.p76-84.
Abstract
Tumor detection can be carried out via the detection of proteins, such as p53, which is known to play vital role in more than 50% of all cancers affecting humans. Early diagnosis of tumor detection can be achieved by decreasing the lower detection limit of p53 bioassays. Microwave-accelerated bioassay (MAB) technique, which is based on the use of circular bioassay platforms in combination with microwave heating, is employed for the rapid and sensitive detection of p53 protein. Direct sandwich ELISA was constructed on our circular bioassay platforms based on DNA-protein binding interactions. Colorimetric and fluorescence based detection methods were used for room temperature bioassay (control bioassay; total bioassay time is 27 hours) and bioassay using microwave heating (i.e., the MAB technique; total bioassay time is 10 minutes). In the colorimetric based detection, a very high background signal due to the non-specific binding of proteins for the bioassay carried out at room temperature and a LLOD of 0.01 ng/mL for p53 was observed using the MAB technique. The LLOD for the fluorescence-based detection using the MAB technique was found to be 0.01 ng/mL. The use of circular bioassay platforms in the MAB technique results in microwave-induced temperature gradient, where the specific protein binding interactions are significantly accelerated; thereby reducing the background signal and the lower limit of detection of p53 protein.
Keywords: ELISA; p53; DNA-Protein Binding Interactions; Circular Bioassay Platform; Metal Nanoparticles; Plasmonics; Microwave-Accelerated Bioassays; Silver Island Films.
List of abbreviations
MAB: Microwave-accelerated bioassay
SNFs: Silver nanoparticle films PMMA: poly(methyl methacrylate) Ag: Silver
FITC: Fluorescein isothiocyanate
LLOD: lower limit of detection
Introduction
Since its discovery in SV40 transformed cells as T antigen associated protein in 1979, p53 protein is classified as a major tumor suppressor in mammalian tumors [1-3]. Mutations affecting the p53 protein have been identified in more than 50% of human tumors, establishing a direct role of p53 in tumor suppression [2-5]. MDM2 and its structural homolog MDMX are principal down regulators that maintain low levels of p53 in the body, which is essential due to growth- inhibitory activity of p53 [6-8]. Interaction of wild type p53 with MDM2 are investigated using electrophoretic mobility shift assay on polyacrylamide or agarose gels and DNA foot printing [9, 10], fluorescence anisotropy, chromatin immunoprecipitation [11], ELISA based assays [12], flow analysis [13] and RT-PCR [14]. ELISA is the most common method used in health care industry for analyzing biological samples for specific proteins and autoantibodies. Commercially available p53 ELISA kits utilize anti-p53 autoantibodies as capture antibodies or p53 protein coated plates for p53 antibody detection [15]. Typical assay time for such ELISA vary between 4-8 hours (approx. 12-24 hours including coating plates with antibodies and proteins). The lack of availability of a single kit designed to identify p53 autoantibodies and estimate p53 protein levels in biological samples simultaneously provides further opportunities for the development of a single ELISA kit that can be used interchangeably for both applications. Re c e nt l y, t he Asl a n R e se a rc h Gr ou p ha v e demonstrated the proof-of-principle application of the MAB technique using a model protein bioassay and circular bioassay platforms, where significant signal enhancement and reduction of total assay time was observed [16]. Compatibility of the circular bioassay platforms with microwave heating and its various applications has been published previously [16, 17]. Figure 1 shows schematic depiction of the MAB technique’s working principle, which is based on a thermodynamic principle of microwave- induced thermal gradient driven mass transfer, and is similar to Metal-Assisted and Microwave Accelerated Evaporative Crystallization (MA-MAEC) technique developed by our laboratory [17-19]. The mass transfer of proteins from the solution towards the surface is triggered with the microwave-induced temperature gradient, which is generated by microwave heating of all assay components. The temperature of the solution is gradually increased up to 30°C during 20 seconds of microwave heating, whereas the temperature of SNFs surface remains relatively unchanged due to very high thermal conductivity of silver (429 W/mK) as compared to thermal conductivity of water (0.61 W/ mK) and PMMA (0.21 W/mK). It is important to note that SNFs surface also acts as selective binding site for thiolated DNA due to their high binding affinity for primary thiol (and amine) groups in biological materials, which has been well documented and exploited for visualizing proteins in tissues and cells [20-22]. In step 1, the attachment of thiolated DNA onto SNFs is accelerated due to both mass transfer and rapid thiol-silver interactions driven by microwave- induced temperature gradient. In step 2, BSA binds to SNFs surface via primary amine-silver interactions. In steps 3 and 4, p53 binds to DNA and horse radish peroxidase or fluorescein isothiocyanate-labeled p53 antibody binds to p53. It is also important to note that unbound materials are washed away after the completion of each step. Using the MAB technique, each step is completed in 20 seconds and the total assay time including wash steps requires only less than 10 minutes. In this paper, we present results of colorimetric and fluorescence based bioassays for p53 in buffer solution carried out on our circular bioassay platforms at room temperature (i.e., gold standard bioassay) and using the MAB technique based on DNA-protein binding interactions. This bioassay setup can serve two purposes: i) Quantitative assessment of p53 protein from biological media; ii) Analysis of biological media for p53 autoantibodies (by use of secondary detector antibodies, not shown here). Our results show a significant increase in sensitivity of the p53 bioassay, with a LLOD of 0.01 ng/mL using the MAB technique with both colorimetric and fluorescence based detection methods. In comparison to commercially available ELISA kits, our method is ~100 times more sensitive (in terms of LLOD) and the total bioassay time is reduced from several hours to less than 10 min.
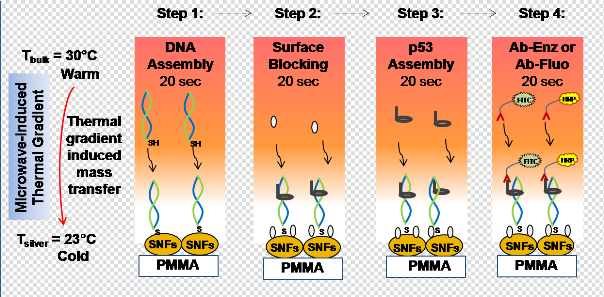
Fig. 1 Schematic depiction of the working principle of microwave-accelerated bioassay (MAB) technique. In step 1, double- stranded and thiolated oligonucleotides are chemisorbed on to SNFs. In step 2, p53 protein binds to the double-stranded and thioated oligonucleotides and BSA binds to the surface of SNFs. In step 3, BSA is added to the surface to minimize the non-specific binding of proteins. In step 4, enzyme-modified antibody (Ab-Enz) or fluorophore-modified antibody (Ab-Fluo) binds the p53 on the surface of SNFs. Please note all unbound materials were washed away after each step. Temperature of bulk (Tbulk) and silver surface (Tsilver) is measured using fiber optic temperature sensors.
Materials and Methods
Materials
Press-to-seal 21-well silicone isolators were purchased from Electron Microscopy Services, PA, USA. Thiolated MDM2 30-mer forward and reverse sequence, wild type p53 protein, anti-p53 monoclonal antibody tagged with horse radish peroxidase (HRP) a nd fl uore sc e i n i sot hi oc ya na t e (FIT C), m e t hyl methacrylate (MMA), n,n-dimethyl-para-toluidine (DMPT), 5 mM HEPES buffer, phosphate buffer saline (PBS), bovine serum albumin (BSA), o-phenylene diamine HCl (OPD), sodium phosphate, citric acid, hydrogen peroxide and sulfuric acid were purchased from Sigma Aldrich, USA. SNFs were deposited using EMS 150R S plasma sputter (Electron Microscopy Services, PA, USA) under argon gas environment with thickness of deposition set at 10 nm. Microwave experiments were performed in 900 W Frigidaire kitchen microwave (Model No-FCM09Z03KB, power level 10). Absorbance was measured using Varian Cary 50 UV-Vis spectrophotometer. Fluorescence excitation was carried out using a laser at 473 nm and the fluorescence emission values was measured using Ocean Optics JAZ spectrometer at 520 nm. Sigma Plot version 11 software was used for statistical analysis.
Human and animal rights
No animal or human subjects were used directly or indirectly in this study.
Methods
Preparation of circular PMMA platform.
100 g of 120000 Da (average molecular weight) PMMA beads were dissolved in 300 mL MMA maintained at 80°C. After solution turns clear, 100 µL of DMPT is added and then the solution is poured in to 5 cm circular polypropylene cups and left at room temperature to polymerize for 7 days. The circular platforms are taken out of the cups and used as is.
Deposition of SNFs.
PMMA platforms were subjected to plasma cleaning for 2 min for molecular level cleaning of the platform’s surface. SNFs with 10 nm thickness are deposited selectively into the wells using a 21-well polypropylene mask using plasma sputtering technique equipped with a film thickness monitor as described previously [16]. The SNFs on PMMA were characterized by scanning electron microscope as described previously [16]. SNFs with 10 nm thickness deposited with sputtering method are in the form of a semi-continuous film and show a broad spectrum without their characteristic surface plasmon resonance peak around 420 nm. The SNFs deposited PMMA platforms (i.e., circular bioassay platforms) are rinsed with deionized water and air dried followed by the attachment of a 21- well silicone isolator. Circular bioassay platforms are stable for up to 6 months when stored at moisture free environment and at 4°C (data not shown).
Bioassay preparation.
Scheme 1 shows depiction of the preparation of circular bioassay platforms and p53 bioassay preparation. In control bioassays, SNFs and p53 were omitted from the bioassays. In a typical bioassay, 300 µL of each forward and reverse thiolated MDM2 sequences in 5 mM HEPES buffer are mixed and kept at room temperature for 90 min for hybridization. 25 µL of solution is then pipetted into each well and incubated at 4°C overnight or using microwave heating for 20 seconds at power level 10. In order to prevent damage to the samples, microwave power was applied in two short durations of 10 seconds each with 2 seconds interval in between. Solutions were discarded by inverting the platform and gently tapping, followed by three micropipette washes with PBS. To minimize the non-specific binding of proteins, 25 µL of 1% BSA solution in deionized water is incubated for 90 minutes at 4°C or with microwave heating for 20 seconds at power level 10. A dilution series of p53 protein is prepared with PBS and concentrations ranging between 0.01 ng/mL to 1000 ng/mL. A 25 µL portion of each p53 solutions is pipetted in to selected wells in triplicates on each circular bioassay platform and incubated for 90 minutes at 4°C or 20 seconds using microwave heating at power level 10. Solutions were discarded by inverting the platform and gently tapping, followed by three micropipette washes with PBS. 25 µL of HRP or FITC tagged anti p53 monoclonal antibodies in PBS were then incubated at 4°C for 90 minutes or using microwave heating for 20 seconds. In case of control experiments, 8 wells without SNFs were selected on each platform and no p53 protein was incubated in them. For colorimetric detection, OPD solution (4 mg of o-phenylene diamine HCl dissolved in 10 mL of sodium phosphate-citric acid buffer (pH 5) and 4 µL of hydrogen peroxide was added one minute prior to use) was added to the wells and incubated for 2 minutes at room temperature. The reaction was stopped using 2 M sulfuric acid and absorbance of the product diaminophenazine (DAP) was measured at 495 nm. For fluorescence detection, 10 µL of deionized water was added to the wells; excitation was carried out using a continuous wave laser at 473 nm and fluorescence emission was measured using Ocean Optics JAZ spectrometer at 520 nm.
Temperature measurements.
Fiber optic probe (diameter: 0.2 mm) is inserted into a well and temperature reading of bulk and SNFs are recorded during microwave heating for 20 seconds. The data is collected and processed using FISO UMI- multichannel system and FISO commander data analysis software.
Data analysis.
Each protein concentration was run in triplicates using separate circular bioassay platforms and the data was collected at 95% confidence limit. Data was plotted and treated for logarithmic fit using Sigma Plot statistical software.
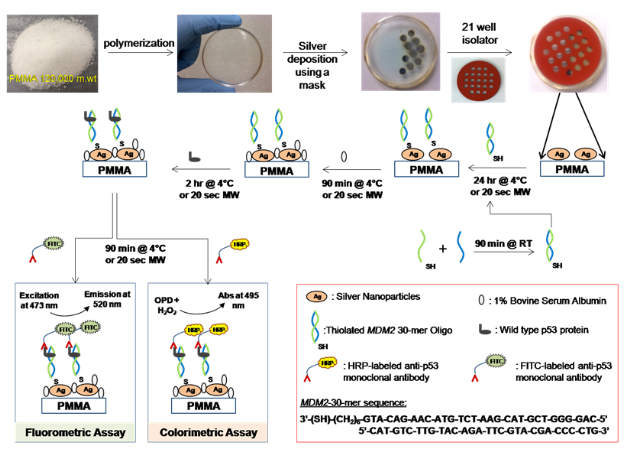
Scheme 1 Schematic depiction of the preparation of the circular bioassay platforms with 21-well capacity and the colorimetric and fluorescence based p53 bioassays. RT: Room temperature, MW: Microwave heating. In control assays, SNFs and p53 were omitted from the bioassays.
Results and Discussion
Figure 2 shows the real-time temperature data of a well filled with deionized water on circular bioassay platform during 20 seconds of microwave heating. The experimental setup (as shown in Fig.2) consists of two fiber optic temperature probes, which were used to simultaneously measure temperature of the bulk (solution) and SNFs layer. It is important to note that temperature measurements were carried out in the same well and the platform was allowed to cool down to room temperature (22°C) in between repeated measurements. The temperature of the bulk during microwave heating for 20 seconds was found to increase from 22.1°C to 29.76°C, where the temperature for SNFs layer was found to remain at 23.72°C. These observations provide direct evidence for our proposed mechanism of the MAB technique, where the temperature of bulk is significantly higher than the SNFs layer and the molecules in bulk are driven towards SNFs due to the microwave-induced thermal gradient between them. Figure 3(a) and 3(b) show the results of colorimetric bioassays for p53 conducted on circular bioassay platforms at room temperature and using the MAB technique. Total assay time for bioassays carried out at room temperature and using the MAB technique was 27 hours and 10 min, respectively. Figure 3(a) shows colorimetric response obtained as a result of enzymatic activity from room temperature experiments carried out on the circular bioassay platforms. The colorimetric response for the concentration range of p53 protein used in room temperature assays remained constant, which can be attributed to the large extent to of nonspecific binding of proteins that lead to high background colorimetric response. Figure 3(b) shows colorimetric response obtained as a result of enzymatic activity using the MAB technique (i.e., 20 seconds of microwave heating) carried out on the circular bioassay platforms. The colorimetric response was increased in a linear fashion as the concentration of p53 is increased. The extent of background colorimetric response was comparable to that observed for p53 bioassays carried out at room temperature, was attributed to the interactions of the colored product generated as a result of enzymatic activity with SNFs (this hypothesis will be explained later in the text based on data shown in Figs.4 and 5). However, it is important to note that high background observed with the MAB technique have no impact on the detection limit of the bioassay since the absorbance value of the lowest detected concentration is 3-fold lager than those observed control bioassay. The lowest concentration of p53 successfully detected using the MAB technique was 0.01 ng/mL, and the linearity of the bioassay was found to be between 0.01 ng/mL to 100 ng/mL. The linear plots with mathematical fitting can be found in the Supporting Information. Figure 3(c) and 3(d) show the fluorescence emission intensities at 520 nm obtained from p53 bioassays at room temperature and using the MAB technique. Figure 3(c) shows that the LLOD of bioassay carried out at room temperature was found to be 1 ng/mL with and linearity of bioassay was found to be between 10-1000 ng/mL. For bioassays carried out at room temperature, fluorescence based detection was found to result in a concentration dependent signal output with a low background signal for the studied p53 concentration range as compared to colorimetric based detection. Figure 3(d) shows the results of fluorescence based detection of p53 carried out using the MAB technique. The LLOD of the p53 bioassay was found to be at 0.01 ng/mL, which is ~1000 times lower than LLOD of the room temperature bioassays carried out using circular bioassay platforms. The linearity of p53 bioassay using the MAB technique and fluorescence based detection was found to be between 0.01 ng/mL to 100 ng/mL, which is similar to bioassay linearity observed with colorimetric based detection of p53. However, it should be noted that the background signal for the control bioassay is significantly lower for fluorescence based bioassays using the MAB technique than those observed for the other methods studied here, which implies this technique is more sensitive (in terms of LLOD) than other techniques. The lower background signal in fluorescence based bioassays carried out using microwave heating and silver nanostructures was previously reported and our observations are in agreement with the literature. In order to determine the potential interactions of SNFs with the colored product generated as a result of enzymatic activity and the fluorophores that might contribute to the observed background signal after completing the bioassays, the circular bioassay platforms were characterized before and after conducting bioassays at room temperature and using the MAB technique. Figure 4 shows the real-color photographs of the circular bioassay platforms before and after both the colorimetric and fluorescence based bioassays were carried out at room temperature and using the MAB technique. As shown in Fig.4(a), SNFs appeared as homogeneous and semi-continuous films on the circular bioassay platforms before bioassays were carried out. The assignment of wells for the specific concentration of p53, control bioassay (i.e., no p53) and wells filled only with deionized water (i.e., unused) are kept the same for all bioassays. After the colorimetric bioassays were carried out at room temperature and using the MAB technique (Fig.4(b)), the color of SNFs changed from light to dark brown in the wells with p53 present and appeared as a heterogeneous film. In addition, SNFs appeared to be detached from the unused wells and the wells where the control bioassays are carried out. The observations discussed above can be attributed to: 1) the change in the dielectric constant of SNFs due to the presence of proteins and the colored product and 2) loss of SNFs due to detachment from the surface during washing steps. After the fluorescence based bioassays were carried out at room temperature and using the MAB technique (Fig.4(b)), SNFs with p53 present appeared as homogeneous film accompanied by a slight change in their color. In addition, SNFs appeared to be retained in the unused wells and the wells where the control bioassays are carried out. These observations imply that the dielectric constant of SNFs were changed as a result of protein absorption (as expected) and there was no significant loss of SNFs from the circular bioassay platforms used in the fluorescence based bioassays. In order to corroborate the observations made by real-color photography, blank PMMA and SNFs on circular bioassay platforms were characterized using optical absorption spectroscopy and are shown in Fig.5. As expected for an optically transparent polymer film, blank PMMA (i.e., without SNFs: line 1 in Fig.5(a)) have a low and constant absorbance value over the wavelength range of 400-600 nm. The deposition of SNFs (10 nm thick: line 2 in Fig.5(a)) resulted in broadening of the absorbance spectrum over the same wavelength range without a dominant SPR peak, which implies the presence of a semi-continuous layer typical nature of metal films deposited using plasma sputtering method. After the completion of the colorimetric bioassays at room temperature (labeled as 3 in Fig.5(a)), the absorption spectrum of SNFs increased at all wavelengths, which can be attributed to the change in the dielectric constant of SNFs due to absorption of other materials. In order to ascertain this hypothesis, the absorption spectrum of the colored product in solution was measured (line 5 in Fig.5(a)) and compared with the absorption spectrum of SNFs after the bioassay was completed. Since all unbound material was removed from the surface via rigorous washing steps and proteins do not absorb light at the wavelengths of 400-600 nm, the only logical explanation for the observed increase in the absorption spectrum SNFs after the completion of colorimetric bioassays is the non-specific absorption of the colored product on SNFs. On the other hand, the absorption spectrum of SNFs after the completion of colorimetric bioassays using the MAB technique showed a slight decrease between wavelengths 400-500 nm and a minimal change at wavelengths >500nm, which can be attributed to the loss of SNFs from the surface. Although the absorption of the colored product on SNFs using the MAB technique is not completely overruled, its extent was deemed low from the absorption spectrum shown in Fig.5(a) (line 4). The absorption spectrum of SNFs showed a slight increase at all wavelengths after the completion of the fluorescence based bioassays at room temperature and using the MAB technique (labeled as 3 and 4 in Fig.5(b), respectively), which can be attributed to the change in the dielectric constant of SNFs due to the present of proteins and FITC. To determine the potential contribution of absorption of FITC to the observed increase in the absorption spectrum of SNFs, the absorption spectrum of FITC in solution was measured and shown in Fig.5(b) (line 5). Since FITC absorbs light at wavelengths <520 nm and a small background signal due to non-specific binding was observed (Fig.3(b)), the increase absorption spectrum of SNFs at these wavelengths can be attributed to the presence of FITC on SNFs. In summary, we have successfully demonstrated the application of the MAB technique using our circular bioassay platforms for the rapid and sensitive detection of p53 in buffer based on colorimetric and fluorescence based detection schemes. The bioassays for p53 was completed in less than 10 minutes using the MAB technique and circular bioassay platforms, which is significantly faster than the identical bioassays carried out at room temperature that required several hours to complete. The bioassays carried out using the MAB technique and fluorescence based detection was found to be more sensitive (~100-fold decrease in the lower limit of detection) as compared to the colorimetric counterparts. One can apply the MAB technique and the circular bioassay platforms described here to rapid and multiplexed detection of proteins and other antigens of interests in complex biological medium such as serum and whole blood. These investigations are ongoing and will be reported in due course.
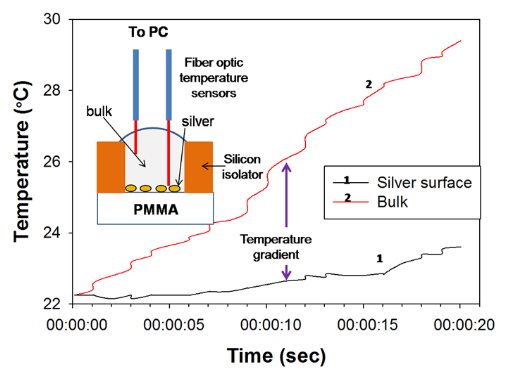
Fig. 2 Real-time temperature of silver surface and bulk (i.e., water) in a well on circular bioassay platforms measured inside a microwave cavity using fiber optic temperature sensors. Inset depicts the experimental setup for temperature measurements.
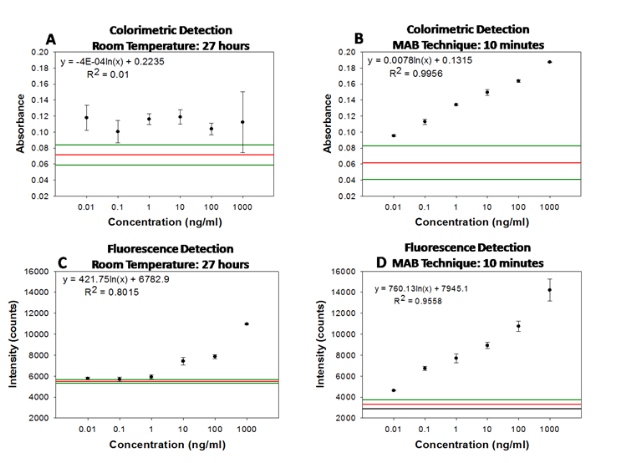
Fig. 3 Absorbance of DAP obtained from calorimetric bioassay for p53 carried out on circular bioassay platforms at (a) room temperature and (b) using MAB (each step: microwave power level 10 for 20 seconds). Fluorescence intensities obtained from fluorescence based bioassays for p53 carried out on circular bioassay platforms at (c) room temperature and (d) using MAB (each step: microwave power level 10 for 20 seconds). The three horizontal lines indicate the background absorbance (largest, average and lowest values from top to bottom, respectively) obtained from control experiments, where SNFs and p53 were omitted from the bioassays. Please see Figures S1 and S2 in Supporting Information for linear plots and fits for the data presented here.
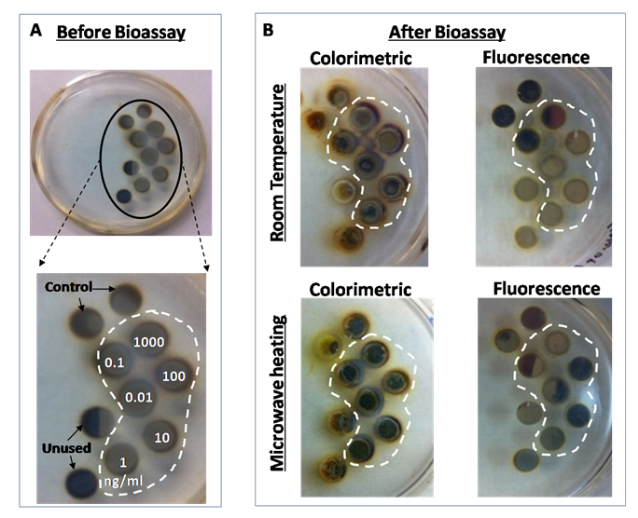
Fig. 4 Real-color photographs of circular bioassay platforms (a) before bioassays: the numbers indicate the wells assigned to the specific concentration of p53 used. Control: control bioassay without p53. Unused: water only (no bioassay), and (b) after the completion of colorimetric and fluorescence based bioassays at room temperature and using MAB. Note that the silicon isolators were used in all bioassays but not shown here for clarity of the pictures.
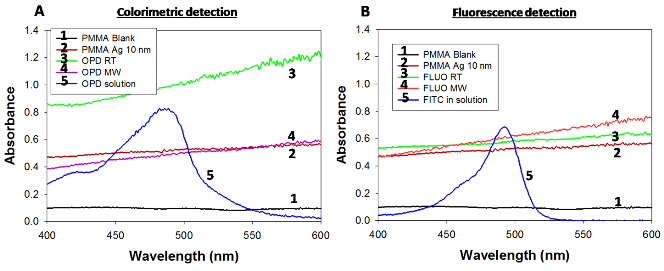
Fig. 5 Absorption spectrum of SNFs on circular bioassay platforms used for (a) colorimetric bioassays and (b) fluorescence based bioassays. OPD: Colorimetric response, FLUO: Fluorometric response, RT: Room Temperature, MW: Microwave heating. Ag: Silver.
Acknowledgments
This work was supported by National Institute of Biomedical Imaging and Bioengineering, award number 5-K25EB007565-05. The content is solely the responsibility of the authors and does not necessarily represent the official views of the National Institute of Biomedical Imaging and Bioengineering or NIH.
References
[1] O.D. Staples, R.J. Steele, and S. Lain, p53 as a therapeutic target. Surgeon 2008, 6(4): 240-243.
[2] F. Chen, W. Wang, and W.S. El-Deiry, Current strategies to target p53 in cancer. Biochem Pharmacol 2010, 80(5): 724-730.
[3] M. Farnebo, V.J. Bykov, and K.G. Wiman, The p53 tumor suppressor: a master regulator of diverse cellular processes and therapeutic target in cancer. Biochem Biophys Res Commun 2010, 396(1): 85-89.
[4] R. Lubin, et al., p53 antibodies in patients with various types of cancer: assay, identification, and characterization. Clin Cancer Res 1995, 1(12): 1463-1469.
[5] J.S. Kovach, et al., Mutation detection by highly sensitive methods indicates that p53 gene mutations in breast cancer can have important prognostic value. Proc Natl Acad Sci U S A 1996, 93(3): 1093-1096.
[6] L. Huang, et al., The p53 inhibitors MDM2/MDMX complex is required for control of p53 activity in vivo. Proc Natl Acad Sci U S A 2011, 108(29): 12001-12006.
[7] A. Madhumalar, et al., Design of a novel MDM2 binding peptide based on the p53 family. Cell Cycle 2009, 8(17): 2828-2836.
[8] F. Lu, et al., Proteomimetic libraries: design, synthesis, and evaluation of p53-MDM2 interaction inhibitors. J Comb Chem 2006, 8(3): 315-325.
[9] E. Kim, et al., Influence of promoter DNA topology on sequence-specific DNA binding and transactivation by tumor suppressor p53. Oncogene 1999, 18(51): 7310-7318.
[10] E . Ki m , N. Al bre c ht se n, a nd W. De ppe rt , DNA- conformation is an important determinant of sequence- specific DNA binding by tumor suppressor p53. Oncogene 1997, 15(7): 857-869.
[11] H.J. Ong, et al., Analysis of p53 binding to DNA by fluorescence imaging microscopy. Micron 2012, 43(9): 996-1000.
[12] E. Jagelska, et al., New ELISA technique for analysis of p53 protein/DNA binding properties. J Immunol Methods 2002, 267(2): 227- 235.
[13] M.A. Noureddine, et al., Probing the functional impact of sequence variation on p53-DNA interactions using a novel microsphere assay for protein-DNA binding with human cell extracts. PLoS Genet 2009, 5(5): e1000462.
[14] W. Goh, D. Lane, and F. Ghadessy, Development of a novel multiplex in vitro binding assay to profile p53-DNA interactions. Cell Cycle 2010, 9(15): 3030-3038.
[15] J. Rohayem, et al., Comparison of the diagnostic accuracy of three commercially available enzyme immunoassays for anti-p53 antibodies. Clin Chem 1999, 45(11): 2014-2016.
[16] M. Mohammed, and K. Aslan, Design and Proof-of- Concept Use of A Circular PMMA Platform with 16-Well Sample Capacity for Microwave Accelerated Bioassays. Nano Biomed Eng 2013, 5(1): 20-27.
[17] A.M. Alabanza , M. Moha m m e d, a nd K. Asl a n, Crystallization of l-alanine in the presence of additives on a circular PMMA platform designed for metal-assisted and microwave-accelerated evaporative crystallization. Cryst Eng Comm 2012, 14(24): 8424-8431.
[18] M.A. Pinard, et al., Rapid crystallization of L-arginine acetate on engineered surfaces using metal-assisted and microwave-accelerated evaporative crystallization(). CrystEngComm 2012, 14(14): 4557-4561.
[19] M. Mohammed, et al., Rapid and Selective Crystallization of Acetaminophen using Metal-Assisted and Microwave- Accelerated Evaporative Crystallization. Nano Biomed Eng 2012, 4(1): 35-40.
[20] Z. Huang, et al., Modulating DNA-templated silver nanoclusters for fluorescence turn-on detection of thiol compounds. Chem Commun (Camb) 2011, 47(12): 3487-3489.
[21] Y. Lin, et al., Highly sensitive and selective detection of thiol-containing biomolecules using DNA-templated silver deposition. Biosensors and Bioelectronics 2011, 28(1): 339-343.
[22] A.A. Zinchenko, et al., Thiol-mediated anchoring of silver cations to DNA for construction of nanofibers on DNA scaffold. Biomacromolecules 2012, 13(6): 1787-1793.
Copyright© 2014 Muzaffer Mohammed and Kadir Aslan. This is an open-access article distributed under the terms of the Creative Commons Attribution License, which permits unrestricted use, distribution, and reproduction in any medium, provided the original author and source are credited.

|
Nano Biomedicine and Engineering. Copyright © Shanghai Jiao Tong University Press |
 |