Article
Macrophage Cellular Adaptation, Localization and Imaging of Different Size Polystyrene Particles
Furong Tian1*, Adriele Prina-Mello2*, Giovani Estrada3, Andrea Beyerle1, Winfried Möller1, Holger Schulz1, Wolfgang Kreyling1, Tobias Stoeger1
1 Comprehensive Pneumology Center, Institute of Lung Biology and Disease, Helmholtz Zentrum München, German Research Center for Environmental Health, Ingolstaedter Landstr. 1, D-85758, Munich, Germany.
2Centre for Research on Adaptive Nanostructures and Nanosciences, Trinity College Dublin, Ireland.
3Institute of Bio-informatics, German Research Center for Environmental Health, Ingolstaedter Landstr. 1, D-85758, Munich, Germany.
*authors gave same contribution in the paper
*Corresponding authors. Email: furong.tian@helmholtz-muenchen.de prinamea@tcd.ie
Citation: F. Tian, et al., Macrophage Cellular Adaptation, Localization and Imaging of Different Size Polystyrene Particles. Nano Biomed. Eng., 2009, 1(1): 13-26.
DOI: 10.5101/nbe.v1i1.p13-26
Abstract
Several studies have tackled the evaluation of the biocompatibility of nanomaterials in cell and tissue. Nonetheless to date, a quantitative technique for the assessment of the total intracellular nanocarrier dose administered has not been introduced. In this paper we develop two rapid and sensitive assays for the measurement of internalized nanomaterials in macrophages to be applied as vehicular carriers for drug delivery and contrast imaging applications. Five commercially available polystyrene particles with different diameters (from 20 to 1000 nm) were used and imaged by using a 3dimensional confocal imaging techniques. The two proposed assays are: “volumetric” assay which evaluate the spherical volume of internalized particles and 2) “max-flat” assay which evaluate the total differential area between cells and internalized particles. These two assays were then compared to a reference method. Among these three assays, the “max-flat” assay was found to be the most reliable and accurate to quantify and investigate the total content of internalized nanomaterials. The “max-flat” assay also allowed for a 3dimensional subcellular investigation of the adaptation and localization mechanisms between cytoskeleton and internalized materials, which may help to further increase the selectivity and delivery of active and passive biopolymers. Therefore, we believe that the here presented assays could become a useful tool to address many biomaterials questions, especially where the key issue is the quantitative assessment of dose effect issues related to the size dependence response of nanomaterials.
Keywords: PolystyreneParticles; Macrophage; Adaption; Localization; Imaging
1. Introduction
The continuous development of novel biomaterials for drug delivery and medical treatment have been receiving increasing attention since they could represent an attractive approach for novel clinical treatment or prevention of many common acquired or inherited human diseases [1]. Many studies have evaluated the kinetics of nanomaterials into cells and tissue by tracking particle location and by dose response [2]. The recent issue of Molecular Pharmaceutics highlights polymer coded gold nanorods can be tracked by near-infrared laser irradiation (NIR) on tumor mice [3]. The identification of a suitable quantitative assay to evaluate the mechanisms of drug delivery carrier is indeed important in the biotechnology, tissue engineering and medical industry. Macrophages, lung, kidney and epithelium cells are the front runner biological system mainly exposed and involved in the uptake and interaction and neutralization of ultra fine powders, particles and man- made materials. To this purpose, macrophage cell has being the most suitable cellular model to adopt in directing the host inflammatory, immune processes and impact response on material biostability and biocomp atibility [4]. There, the quantitative assessment of the “carrier/vector” cellular uptake is a critical information to evaluate the efficacy of the novel nano biomaterials. Several methodologies for the quantitative assessment and evaluation of particle uptake have been available for many years. Bronchoalveolar Lavage (BALF) assay by cytospin centrifugation has been widely used as an effective technique to test the interaction response of particles with cells since last century [5]. Recently, a new perspective on the analysis of internalised mass was reported by Moss and Wong [6]. In the past, macrophages were associated with the investigation and analysis of spherical shape object from top and side imaging views. From their study, it emerged that the best way to determine the real number of particles is by using a three dimensional (3D) image analysis. However, this study suffers of limitations when measuring particles with diameters smaller than 800 nm [6]. From this study it emerged the need to develop a “particle size dependent quantitative methodology”. Other studies have shown that the qualitative interpretation of small-representative-samples from confocal and electron microscopy sections can not be a feasible solution especially when measuring internalized nanoparticles [2, 7]. There, it resulted extremely difficult to remove artefacts and to identify each particles when measuring the internalized nanocarriers by direct imaging analysis technique. Recently, it has been reported that spherical fluorescent polystyrene (PS) beads were phagocytozed into fibroblast cells in large numbers to become ordered into hexagonally close packed stacks [8]. Kodali et al. (2007) defined the “viable” particle stacking location has been defined as the relative ratio between the particle size versus the local cell height determines the approximate accessible “space for storage”. In their study, Kodali and coworkers used fibroblast cell type which presented a highly confined volume to a phagosome, approximately like a flattened spread cell. This changed during the phagocytosis of a bead where the membrane significantly deformed and the bead is pulled through this region during the membrane retracting motion. Their measured average nuclear height of the fibroblasts resulted to be 5.1 ± 1.1 µm [8]. Thus, speculations can be done over the “flattening” effect of a cell as an enhancement for particle detection and subsequently reduction in artefacts and particle layer overlapping. Over the past decade, several methods have proposed ways to modify the substrate surface chemistry with immobilized ligands or proteins to enhance macrophage adhesion [9-10]. Fibronectin (Fn) has been used to enhance the actin polymerization on neutrophils, monocytes and macrophages [11]. An accurate concentration and fibronectin coating technique is essential for the formation of receptor clusters and subsequently cell adhesion. In this paper, one of our aims is to investigate and identify the optimal macrophage spreading condition onto fibronectin. Various concentrations of Fn were adopted on substrate to maximize alveolar macrophage adhesion and directly control cell spreading, height and shape. Another crucial element for the development of quantitative assays for biocompatibility response morphological analysis is the interaction between different particle size and the cell cytoplasm storage compartment. Five commercially available polystyrene beads with diameter ranging between 20 to 1000 nanometre were used and imaged to establish the most suitable quantitative assays to employ. Among the commercially available nanostructured materials, fluorescent spherical polystyrene beads are known to have low toxic response with fully characterized geometry and surface chemistry. Therefore, they have been widely used and applied for in vivo experiments since they do not induce any endogenous response [12]. Then, the fluorescent chemical covalent bound on the particle surface allows the imaging as internalized mass into cell, under fluorescent microscopy [13]. In this work, we introduce a novel quantitative assay, called “max-flat assay”, where the macrophage morphological responses have been based on the investigation of macrophages in spherical cell, or adherent form when interacting with different concentration of polystyrene particles. The assay is based on the total surface ratio between particles and cell when adherent to a fibronectin coated substrate. We validate the assay for all nanoscale size particle distribution adopted within the cell. The second assay we introduce for quantitative biocompatibility evaluation is called “volumetric” and based on the total spherical volume evaluation between particles and spherical macrophage cell. Both assays were developed to compare the efficiency of the measured number of internalized particles in flat and spherical macrophage cell. These two assays are then correlated to a well know and accredited biocompatibility assay. Since the cell cytoskeleton plays an important role in particle location and cell adhesion [8] actin and microtubule are also investigated to explain the relationship between cytoskeletal organelles and nanoparticle distribution. The cytoskeletal rearrangeent mechanisms evoked during the internalization, localization and storage of the nano particles resulted to be important for the development of both quantitative technique. Therefore in this paper we speculate on the mechanisms involved in macrophage microarchitecture regulation, adaptation and storage of the internalized nanomaterials. This may help to further increase the target selectivity and specificity of novel biopolymers. Therefore, we believe that the here presented assays could become a useful tool to open large opportunities and perspectives in the biomaterials, tissue engineering and medical industry.
2. Materials and Methods
2.1 Polystyrene particle: specification
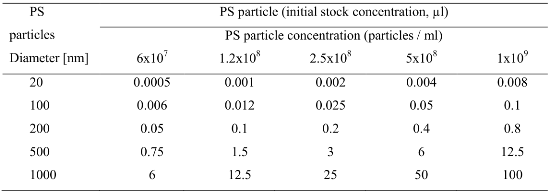
Polystyrene (PS) particles at the diameter of 20 nm, 100 nm, 200 nm, 500 nm and 1000 nm (Molecular probes, USA) were purchased from Invitrogen (Invitrogen Ltd, UK). All the particle size batches were prepared at the same concentration of 0.5%w suspended in 50 mM Na3PO4, 50 mM NaCl, at pH 7.5. In this study, the particle volume used was constant throughout all the particle size range and set at NP/mL. This in order to obtain a constant number of particles to cell ratio set (Table 1). A simple calculation, to establish the total dose preparation (e.g., number of particles per mL) for each particle size from the initial stock concentration is:
![]()
Taking into account the geometrical and rheological properties of the particles and the stock solution, this becomes:
![]()
Where NP number of particles per mL used, C concentration of suspended beads from stock (0.02 g/ml for 2 % suspension) It is initial concentration, ρ is the density of polystyrene in (ρ = 1.05 g/cm3) and φ =the diameter of the particles used (expressed in µm). The summary of the polystyrene particle propertyes and used concentration is here reported in table 1.
2.2 Cell type and culture procedure
Murine macrophage cell line RAW264.7 were obtained from the American Type Culture Collection (ATCC) and grown in Dulbecco's minimal essential medium (DMEM) containing 10% foetal bovine serum(FBS), 1% Lglutamine and 1% penicillin– streptomycin at 37°C, 5 % CO2.and 9 5% relative humidity (Incubator model: MCO-20AIC, SANYO, Japan).
2.3 Particle internalization and substrate preparation
Macrophages particles ingestion and internalization was achieved in sterile 50 mL tube (Falcon, USA) under gentle stirring to maximize the cell particle internalization process efficiency. Macrophages (1x10⁴/ml) with internalized particles were then prepared for high contrast image acquisition. Three preparation procedures were used: 1) single droplet on microscopy glass slide; 2) Fn coated on purposely prepared microscopy glass cover slip, and 3) Cytospin technique (used as reference technique). Gentle rotation was carried out for 2 hours at 30 rpm at 38°C (rotator model ST, New Brunswick Scientific Company, New Brunswick, New Jersey). Each procedure was used for: 1) the single droplet preparation method was used to evaluate the particle accumulation in spherically shaped macrophages. Thus, single drops from each particle size solution were precisely located on microscopy glass slides. 2) The Fn coating onto substrates was achieved on purposely prepared glass cover slips (φ = 10 mm, MatTek Corporation, MA, USA) by a 20 µl coating of fibronectin III at different concentrations (Sigma Chemical Co. St. Louis, MO). These being: 3x10⁻⁴, 6 x10⁻⁴, 1.2x10⁻³, 2.5x10⁻³ and 5x10⁻³mg/ml. 3) Cytospin technique. Glass slides were cleaned with alcohol, assembled with a slide filter card and sample delivery chamber secured by a metal clip. Cell suspensions in medium were rotated for 4 hours at the same physiological condition, as to the chamber and then after spinning at 400 above. Each samples, 0.5 mL. each, were added rpm for 6 minutes, the slides were removed from the cytospin chamber (Shandon, Southern products Ltd.). A high speed centrifuge was then carried out to spread the cells and subsequently obtain a uniform monolayer of 6 mm in diameter on each slide. These cell monolayers were then fixed in formalin and stained.
Table 1.. Commercially available polystyrene nanoparticles: particle size, concentration and total
oncentration used in this study.
2.4 Cells fluorescent staining: preparation
After the cells were seeded onto the coverslips and incubated for 2 hours in complete DMEM, the cells were fixed with 4% paraformaldehyde in PBS at room temperature for 30 minutes. They were then washed again with PBS and permeated with 0.1% Triton X-100 for 3 minutes at room temperature. Cell were subsequently stained with mouse anti-actin (A4700, Sigma, Taufkirchen, Germany) and anti-α-tubulin (T4026, Sigma) antibodies by a FITC conjugated secondary anti-mouse antibody (F0257, Sigma) and ChromeoTM 642 Goat anti-Mouse IgG (ACTIVE MOTIF, Germany). The cell nucleus was stained by 10 mM Hoechst for 1 minute. Finally the stained coverslips were mounted for fluorescence microscopic examination.
2.5 Confocal laser microscopy imaging
Data were obtained using a Zeiss Laser Scanning Microscope (LSM 510 META from Zeiss, Germany). The LSM was based on the Axiovert 100M inverted research microscope equipped with 4 laser sources. Optical sections collected at different levels perpendicular to the optical axis are here presented. Laser source, filter, pinhole and laser power were identical through all experiments as reported in Table2.
2.6 Internalized particle localization and cellular morphology analysis
In order to study the relationship between cell geometry and particle internalization and localization, different size of polystyrene particles were used on different substrates, as previously described in section 2.3. The fluorescent particle size range here adopted was also chosen to establish and measure the optimal particle uptake amount and extent of cellular morphological and cytoskeletal changes. The fluorescent signal emission of the polystyrene particles (excitation 505 nm) was measured in contrast to the cytoplasmic staining signal. These signals were recorded, processed and analyzed with Image J. The cell particles interaction was normalized for the three techniques here under investigation.
2.7 Comparison of internalized polystyrene particles by volumetric, max-flat and cytospin assay.
Five commercially available polystyrene beads with diameter ranging between 20–1000 nanometre were used at five different concentrations, as reported in section 2.1. These were: 6x10⁷, 1.2x10⁸, 2.5x10⁸, 5x10⁸ and 1x10⁹ particles/ml and were chosen to compare the three different biocompatibility assays under validation. The first assay introduced during this study is called “volumetric” assay and is based on the exact evaluation of the total spherical volume ratio between cells and particles when cells are in spherical shape, as shown in figure 1. The second assay is called “max- flat” assay and provides the ratio between particles occupied area and individual particle area when cells are in flat shape. The third assay here adopted is a reference technique called cytospin technique widely used in biocompati-bility and toxicology.
(1) Volumetric assay: the spherical volume ratio between macrophages and particles is an important parameter for the assessment of the changes in the cytoplasmic cell morphology. There, the particle distribution is assumed to be homogenous within the spherically shaped macrophages; the particle number (NP) per cell is related to the respective volume (VP) occupied by the particles. It is known that macrophage are not totally spherical but have a conical, or dome shaped, geometry, as shown in figure 1c and reconstructed in figure 1d. Thus from each 3D images taken for each macrophage examined, the nucleus heights (hN), nucleus diameter (DN) and macrophage diameter (Dp) were measured by AimImageBrowser.
(2) Software (AIB, Zeiss, Germany), as shown in figure 1. Then, the accumulated particle-region heights (hP) and diameter (DP) were also measured by AimImageBrowser software.
(3) The volume of the particles-region is defined as,
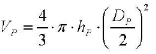
(4) Where DP is the total diameter of the accumulated PS particles inside the cell.The volume of the macrophage nucleus is defined as,
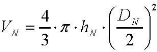
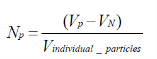
The number of internalized particles per cell can be determined in two ways:
(1) as the volumetric ratio between the total volume occupied by the particles subtracted by the volume of the cell nucleus and then divided by the volume of a single particle.
(2) The max-flat assay is the second way. There, a measurement of the flattened cell was carried out to evaluate the ratio between the particles and the cells when adherent to a fibronectin coated substrate and to the glass substrate respectively.
Since these two assays are based on the evaluation of the total surface particle-cell ratio when adherent to the substrate, the equation that describe both assays is then,
Where AM is the total area of the internalized particles and AN is the area of the cell nucleus. In this case, since each cell is flattened to the substrate, the alculated macrophage area is an exact estimation of the whole cell surface. Enhanced confocal microscopy imaging (Figure 1a) was carried out and transferred into a high resolution black and white format in Image J (Figure 1b). There, the fluorescence signals of the PS particles are represented by the black dots and measured by Image J software. The final number of internalized particles is then derived by the ratio of the overall fluorescent signal intensity associated with every cell imaged and the relative emission of each isolated fluorescent PS particle.
![]()
A further expansion to the cell-particle quantitative assessment was also introduced by taking into account the difference between cell height and particles size. This was carried out by availing of the middle cross section stack area, as shown in figure 1e. There, the particle counting is obtained by the measurement of the area occupied by the internalized particles subtracted to the area of the cell nucleus timed by the number of stacks used (see figure 1f), as here below reported.
![]()
Where AN is the macrophage area of the nucleus; Ap is the total area of the particle in a single layer stack; hp is the particles height and is the number of image slices taken for each stack. This is a calculated constant and it is equal to the measured particles height divided by the particle nominal diameter![]() Therefore, is equal to 1, 3, 5, 10 and 50 for the particle diameter of 1μm, 500nm, 200nm, 100nm and 20 nm, respectively.
Therefore, is equal to 1, 3, 5, 10 and 50 for the particle diameter of 1μm, 500nm, 200nm, 100nm and 20 nm, respectively.
Table 2. Laser Scanning Microscope: imaging experimental parameters used
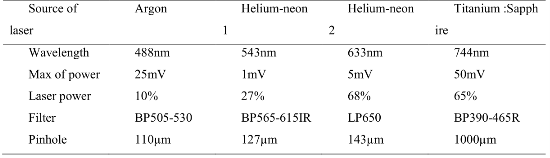
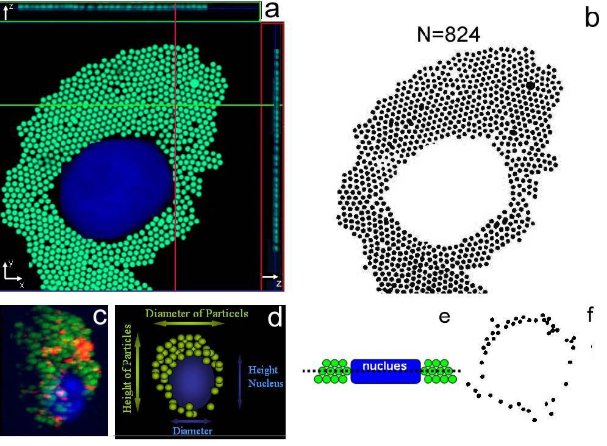
Figure 1. (a) Confocal micrograph of adherent macrophage to fibronectin coated substrate. Figure 1(b) shows the Image J threshold analysis of figure 1(a) confocal micrograph. Measured particles in black and white. Figure 1(c) Confocal micrograph of adherent macrophage to uncoated substrate. 3-dimensional confocal micrograph showing the uniform distribution of particles inside the cytoplam in a spherical cell macrophage. Figure 1(d) 3D schematic description of main parameters involved for the quantitative analysis of nanomaterials biocompatibility evaluation. Horizontal arrows show whole internalized particle mass and nucleus diameter respectively. Vertical arrows show whole internalized particle mass and nucleus height respectively. Figure 1(e) 2D Schematic reconstruction of confocal micrograph cell-particles localization. In the cross section cartoon the PS particles are in green and nucleus in blue. Figure 1(f) 2D top view reconstruction of localized particles after nucleus suppression.
2.8 Statistical analysis
The statistical analysis of the difference between experimental samples and controls were carried out by using Matlab statistical analysis package (Massachusetts,USA). A one way Analysis of Variance (ANOVA) test was used to quantify the difference between the different fibronectin concentrations used. The experimental data analysis was performed with regression tests with confidence bounds which correspond to a 95% confidence interval; best fit values of each model were also examined and goodness of fit was quantified by the sum-of-squares. Statistically significance was set to p<0.05.
3. Results
3.1 Quantification of the internalized particles
Twenty five independent experiments (Nparticles=25) were successfully carried out to quantify the number of internalized particles per cell investigated by three assays: volumetric, “max-flat assay” and cytospin assay for the macrophage cells under examination, as shown in figure 2. Macrophage cells were initially exposed to an increasing concentration of particles such as: 6x10⁷ , 1.2x10⁸ , 2.5x10⁸ ,5 x108and 1 x10⁹per ml, and subsequently article counting was carried out. Comparison among the three assay quantitative counting was carried by direct correlation of the particle found inside the cytoplasm versus the initial particle concentration introduced. Qualitatively this comparison is particularly evident from the confocal images taken of the cell morphology and particle distribution across the cell cytoplasm, as shown in figure 2. There macrophage were all incubated with an initial oncentration of 1x10⁹ PS particles/ml. Quantitative confirmation of such evidence was then measured for all the particle sizes used in the study. From the systematic count of all internalized particles, it was consistently found that the max flat assay always gave a higher cytoplasmic particle count across all the particle size distribution chosen. There, the main results can be seen in figure 3a, and 3b, where the relationships between dispersed PS particle size of 1000 nm and 100 nm in medium are correlated with the measured ones inside the macrophage cytoplasm, respectively. Another important result that emerged from this quantitative analysis is linked to the region around the particle saturation concentration, identified for macrophages at approximately 1x10⁴ cells/ml. There, the “max-flat assay” gave a consistently higher particle count inside the cytoplasm than the volumetric and cytospin assays. This means that the higher the particle saturation the better the cell image resolution. This is proven to be statistically significant by the Kruskal-Wallis test (non parametric ANOVA) and in particular had p <0.001 for the max flat assay with subsequently less uncertainty. For all the other particle size the investigation showed a similar regression trend. There, it can be seen that the trend line for the flat cell has a steeper slope than the one for the cytospin and volumetric assay.
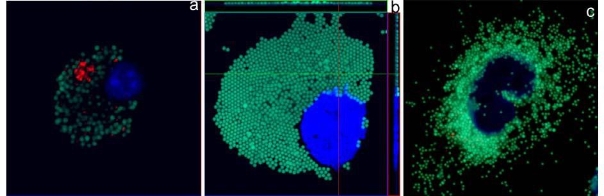
Figure 2. Confocal images of macrophages with internalized particles (initial seeded concentration = 1 x 10⁹ particles/mL). Comparison between three investigated assays: figure 2(a) highlights the morphology of spherically shaped macrophage with internalized particles. Figure 2(b) shows the morphology of particle distribution in flattened cell onto treated fibronectin substrate. Figure 2(c) shows the localization of internalized particles inside cell when treated by cytospin. Particles are in green and nucleus is in blue.
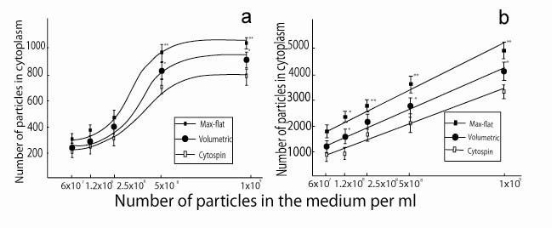
![]() Figure 3. Assay evaluations for 100 and 1000 nm PS particles. Graphical relationships between measured internalised PS particles and seeded PS particle concentrations in culture medium. Both graphs report the mean of the particle number inside the cells for the max-flat assay (
Figure 3. Assay evaluations for 100 and 1000 nm PS particles. Graphical relationships between measured internalised PS particles and seeded PS particle concentrations in culture medium. Both graphs report the mean of the particle number inside the cells for the max-flat assay (![]() ), volumetric assay (●) and cytospin ( ). Each curve represents the three assays linear regression for each data point measured at the following seeded concentrations 6x10⁷, 1.2x10⁸, 2.5 x10⁸, 5 x10⁸ and 1x10⁹ per ml. Each curve represents the particle count measurement for 25 independent cells (initial cell plating concentration = 104 cells/ml).
), volumetric assay (●) and cytospin ( ). Each curve represents the three assays linear regression for each data point measured at the following seeded concentrations 6x10⁷, 1.2x10⁸, 2.5 x10⁸, 5 x10⁸ and 1x10⁹ per ml. Each curve represents the particle count measurement for 25 independent cells (initial cell plating concentration = 104 cells/ml).
3.2 Confocal microscopy imaging of volumetric and “max-flat assay”.
Two quantitative assays were successfully developed to measure the size distribution and the exact number of internalized particles in murine macrophages RAW264.7 to enhance the image resolution of the subcellular structure adaptation of the quantitatively measured up taken particles. Confocal microscopy imaging was used to identify the changes in cell morphology and particle distribution inside the cytoplasm. One of the main differences between the two assays resides on the different sample preparation used before the confocal microscopy imaging. For the “max-flat assay”, macrophages were let to adhere onto a fibronectin coated substrate whereas for the volumetric, macrophages were simply seeded onto the plain glass substrate. This led to an immediate morphological difference in cell shape and cytoskeletal rearrangement induced by the presence of the particles, as shown in figure 4. There, the 3D confocal images of two spherically shaped macrophages, from the volumetric assay, are shown on the left side (figure 4a, and 4c). On the opposite side, 3D confocal images of two macrophages adhering to Fn coating, in their morphologically flattened and spread shape, from the “max-flat” assay are shown on the right side (figure 4b, and 4d). Interestingly, for all the analyzed confocal microscopy images of non-fibronectin coated macrophages it was found that it was impossible to gain any intracellular or cytoskeletal details, as shown in figure 4a and 4c. This was not the case for the “max- flat” assay where we could speculate on the cytoskeletal fibers rearrangemen.
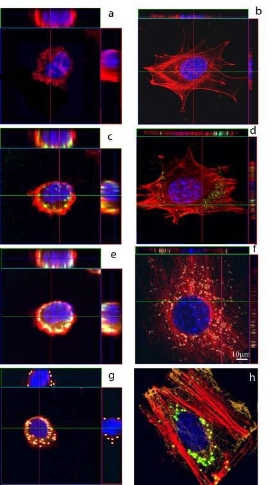
Figure 4. Macrophage morphological geometry adaptation to internalized PS particles. Left column confocal images show the spherical macrophages adapted morphology when cultured on untreated glass substrate. Right column images show the different adaptation of adherent macrophage cell spreading on fibronectin treated glass substrate. Figure 4(a) and 4(b) images for control without any particles. Figure 4(c) and 4(d) reports on 20 nm PS particles. Figure 4(e) and 4(f) reports 100nm PS particles, where figure 4(g) and 4(h) reports on 1000 nm PS particles. Figure 4(d) shows the microtubules (in red) interaction with nanoparticles (bright dots). Figure 4(h) in details highlights the presence and localization of PS particles in green, microtubules expression in red and microtubules in yellow. Nucleus in blue in all micrographs.
3.3 Cell response to the fibronectin coated substrate
In this study, to obtain the highest possible 3-dimensional confocal microscopy resolution it was necessary to achieve the most regular shape in each cell across all the 3-axis. This was obtained by maximizing the natural cell spreading on the adhering ECM or substrate (e.g., cell flattening). The optimization of the macrophages adhesion to the fibronectin ECM-coated substrate played a critical role for the enhancement of the particle counting assessment. Different fibronectin concentrations, varying from 3x10⁻⁴ to 5x10⁻³ mg/ml, were chosen to maximize the cell spreading. As a result of this optimization process, it was identified that a fibronectin coating concentration of 2.5x10⁻³ mg/ml maximized the macrophage spreading on the substrate. This optimal coating was identified by the correlation of the Fn concentration versus i) the maximum cell spreading area, as shown by the graph in figure 5a, and ii) by the minimum cell height, as shown by the graph in figure 5b. Based on these results it was found that the nucleus height is the cell spreading limiting factor. This, in geometrical terms, is the lowest dimension we can force the cell flattening, in the Z-direction, to achieve enhanced confocal imaging uniformity. Therefore for all the measurements carried out in this study, the nucleus-height was used as a reference parameter to assess the cell height measurement. As a result of this we can say that to a minimum in the cell height equated a maximum in the cell-spreading area induced by the optimal Fn concentration, as shown in figure 5a, and 5b.
3.4 Cell geometry and particle measurements
In order to exactly quantify the morphological influence of the internalized particles on the cell adhesion response, all the particles inside the cytoplasm were measured and counted. From the acquired confocal micrographs, it was found that macrophages adhering to uncoated (plain) glass slide assumed the typical spherical shape (Figure 6a). There it resulted very difficult to account for the internalized particles since the particle were not arranged in ordered layers. Conversely when adhering to the Fn coated glass substrate, macrophages resulted to be organized in ordered layers. From the whole investigation analysis it was found that usually the internalized PS particles were ordered in a two layer stack. Hence, it was easy to focus on each stack of the PS particles and carry out any measurement, see figure 6c and 6d. There, the top layer had always fewer particles than the bottom and this gave a “pseudo” flat shape to the imaged macrophage. This was clear when z-stack images were acquired along the X-Z and Y-Z orientation, as shown in figure 6c and 6d. The analysis of the 3D confocal fluorescence stack images showed that the average height of cells adhering to Fn substrates, at optimal concentration of 2.5x10⁻³ mg/ml, is approximately 1.5 ± 0.2 µm (figure 6e). In this case, for all the imaged cells the nucleus height was approximately 1.5 µm. This was not seen at lower Fn concentration, where for a Fn concentration of 1.2x10⁻³mg/ml the nucleus height resulted around 3.0 ±0.2 µm, as shown in figure 6c and 6d. From the analysis of all samples, it was also found that the aspect ratio between cell diameter and cell height was about 20. This was extremely important since the confocal image resolution enhancement on the X-Y axis was linked to this ratio. In addition, it must be pointed out that different particle concentrations induced different cell spreading when interacting on the same Fn coated substrate, as shown in figure 6b, 6d and 6d. This can be seen from the analysis of the data correlating the Fn coating concentrations and the particle counting at cytoplasmic level, showed in figure7. There, the number of particles counted inside the cytoplasm increased with the increase in Fn until it reached the maximum at 2.5 x 10⁻³ mg/ml; from there it decreased back. Furthermore, the bell shape relationships found between numbers of in plane to substrate particles per cell versus concentration of Fn was similar for all the three Fn concentrations plotted in figure 7. This last result is also in agreement with the measured cell height and cell spreading as previously reported and plotted in figure 5a and 5b.
3.5 Cellular organization and rearrangement mechanisms
From all the images analyzed in this study, it came clear that when macrophages arrange into a spherical shape do not show any specific cytoskeleton structural organization, as stated in section 3.4, and highlighted in figure 4. Nonetheless, the PS particles were inside and distributed across the cytoplasm. On the other hand, when a macrophage spreads onto an ECM substrate such as fibronectin, the microtubule cytoskeletal network and the actin filaments spreading inside the cytoplasm became clearly distinguishable (Figure 4b and 4d). When internalized, the different size PS particles contributed to the enhancement of the internal cytoskeletal organization. The ordered stacking of particles also contributed to the identification of the filamentous intracellular network. There, we found that microtubule fibers were radially distributed and tend to direct towards the nucleus. In addition to that, when the particles were localized in between microtubule fibers we could gain a clear contrast enhancement in all the confocal planes viewed, as highlighted in figure 4d. There, the actin bundle structures appeared in straight filaments; whereas for microtubules this occurred as subtle structural networks and radiate across the cytoplasm. In such organized structural subcellular scaffold, the PS particles were entangled within the microtubules, in yellow in figure 4b.
4. Discussions
Macrophages are the front runner biological system mainly exposed and involved in the uptake and interaction and neutralization of men made materials. Recently in the emerging field of nanomaterials and nanotechnology there has been growing needs of quantitative measurement of the total amount or dose of disperse/internalized content of new drug carrier. Many studies have been focused on the evaluation of the dose response of these novel nanomaterials. Therefore, the choice of the most suitable and accurate assay is the critical factor to a correct assessment. At present, the majority of studies published rely on the measurement of the dispersed bulk particle mass. New research studies have started to take into account the particle number or even the particle surface area. When different nanomaterials are brought to comparison the particle surface area plays a critical role to assess the efficacy and response of these novel materials [14,15]. Currently, great efforts have been made to optimize the exposure and develop representative models, little attention has been paid to describe the cellular reorganization triggered by the particles intracellular distribution. However, from the investigation of spherically shaped macrophages it is impossible to map the intracellular localization and overlapping of the internalized particles. The comparative analysis determined by the three assays of the quantitative measurements can be summarized in the three parallel micrographs shown in Figure2, where the results from each assay are shown in a particle size dependence format. Each graph reports the PS particle detected and measured by the image analysis and Image-J threshold. There, it is immediate that the “max-flat assay” had significantly and consistently, across all the particle size chosen, a higher number of internalized particles. The translation of such results into quantitative graphs is shown in figure 3a and 3b for the smallest and largest particle size chosen in this study, 100 nm and 1000 nm respectively. The data plot showed a good statistical agreement by the fact that each curve mean is closer to their respective trendline and each data point has a low standard deviation. In addition to that, the “max-flat” assay. results to be a sensitive assay since it is also a better technique to describe the particle saturation phenomena than the other assays investigated. dditional supporting evidence in favor of the “max-flat” assay is given by the fact that in order to plot the results it was important to factor in the choice of the Z-axis section plane under confocal microscopy analysis. This Z-axis plane resulted to be fixed for the “max-flat” assay, coinciding with the average nucleus height, where for the “volumetric” and cytospin assays different Z-section thickness, and subsequently multiple section images, had to be acquired and analyzed in relation to the concentration and spatial distribution of the internalized particles. In this study we emphasize that the identification of the most suitable Z-axis section-thickness would be a linear process for a homogeneously particle distribution spread across a morphologically “flattened” cell. There, the 2 dimensional particle storage compartment would be expected to be directly proportional to the overall compartment volume. Thus, the calculations were also a straight forward operation by using the analytical expression indicated in the results section and plotted in Figure 1.Conversely when analyzing spherically shaped cells the 3-dimensional random distribution and low concentration of the particles made the analysis difficult for each investigated plane. Therefore, it was necessary to use multiple Z-axis sections to reach the same conclusion as for the max-flat assay single plane analysis. This multiple plane analysis also led to larger error estimation. From the comparison of the three assays under investigation it was found that the “max-flat” assay gave the highest number of particle counted per cell and per single experiment. The “volumetric assay” was the following one and the cytospin resulted to have the lowest particle counting. This latest, can be associated with the particle aggregation and overlapping induced during the cytospin imaging microscopy. On the other hand, with the “max-flat” assay the maximum adhering macrophage surface spreading to fibronectin extracellular matrix provided a clear visible image of the internalized nanoparticles under 2dimensional high resolution imaging as shown in figure 4. One limitation experienced with this assay was that the PS at 20 nm diameter can not be clearly distinguished as individual particle (figure 5). For this set of experiments we could expect a lower count of particle compared to all the other particle size used. It is well known that the cell cytoskeleton plays an important role in the cell morphological adaptation and localization of nanomaterials and nanoparticles. In fact, there is evidence in literature where spores with a nominal diameter of 1 µm follow the orientation of the microtubule organization in vitro [16]. Already Reaven and Axline in 1973 had examined the cytoskeleton of guinea-pig peritoneal macrophages: i) before and ii) after adhesion, and iii) with, and iv) without phagocytotic stimuli by the PS particles (diameter = 15µm) [17]. In their work, they suggested a cellular uptake mechanism where active microfilaments and microtubules stretched the unfolding of the plasma membrane to enhance the cell adhesion during the cell uptaking of big objects such as large particles. A similar cell-particle accumulation mechanism has been also attributed to the explanation of the paclitaxel etanidazole particles in human tumor cytoplasm by Jin and coworkers [18]. In this study, our experimental results showed similar responses. In particular, the smaller the particles, less than 200 nm, the more they got internalized and stored between parallel bundles of microtubules, such as shown in figure 4d. Particles that are trapped, followed the orientation and movement of microtubules and got accumulated closer to the nucleus [19]. In this case we found the geometry of the CSK micro architecture was the limiting factor to the cell height which then also directed the particles toward an ordered arrangement.Cytoskeleton (CSK) also plays an important role in the location of particles and cell adhesion. As stated in the result section, at different particle concentration the maximal cell spreading and minimum cell height was obtained at a fibronectin concentration of 2.5x10⁻³ mg/ml. The density of the Fn coated onto the glass- surface maximize the surface receptor cluster formation and thereby maximize the cell adhesion area on the substrate without introducing any oxidative stress or reactive species [20]. From our experimental evidence we found that even if the particle concentration increases the total internalized particle number does not change the intracellular distribution, as shown in figure Macrophages have a highly dynamic cytoskeletal scaffold attributed to a fast structural organization of the internal microtubule and actin filament bundles as it can be seen in figure 4a and 4c. There, microtubules act as main struts with their hollow but larger cross section where the actin filaments, stiffer, keep the microtubules together in a “geometrically stable” structure (Figure 4b and 4d). The spherically balanced cell drastically changed its shape when seeded onto an “adhesion promoting” extracellular matrix compound such as fibronectin. There, the cellular cytoskeleton was involved in cell adhesion. CSK extracellular filaments protruded out and adhered to the substrate. The binding of the membrane to the cytoskeleton could create a tension in the cell membrane bilayer [21]. This also generated tension within the cytoskeleton to balance the adhesion force resistance and most likely causes the change in cell shape which indirectly drove the particles toward an ordered arrangement. The combined cell- substrate mechanism was supported by the experimental evidence here carried out by confocal microscopy (see figure 4). Furthermore, because of the internal rearrangement of actin and microtubule filaments the bending force on the cell membrane, exerted by the active pulling, could confine the particle to the region where the maximal zero force void space was present. Similar explanation has also been suggested in the work of Kodali and coworkers [8]. A schematic represe- ntation of what we believe is the intervening mechanism during this structural cell scaffolding rearrangement on flattened macrophages is shown in figure 8. Our hypothesis is that the cell membrane (in violet) and the actin filament (in red) are constricting the cytoplasm structure and forcing the rearrangement of the cytoskeletal components (i.e., actin and microtubules) which subsequently force the particle to redistribute. This reduced the accumulation of particles to the immediate vicinity of the nucleus where the filaments forces are almost nill. Though, the smaller particles could still freely move between microtubules; where the larger particles were entangled within the subcellular network structure of the actin filaments and were forced towards the nucleus with formation of dense 2-dimensional clusters, as shown in figure 4b and schematically in figure 8. These combined evidences led us to assume that the relatively “bulky” 1000 nm polystyrene particles were simply “conveniently” stored closer to the perinuclear region of the cytoplasm and a possible explanation can be mainly due to the limited space available inside the cell. This explanation was here supported by the presence of the cytoskeletal forces rearranging and adapting the cell structural organization to the new shape. Among the three assays here developed and examined it was found that the maximum surface spreading of macrophages adhering to fibronectin, called “max-flat assay”, was by far the best method deployed to measure and counts different size internalized nanoparticles under 2D high resolution confocal imaging. Following to that, the preparation of the “volumetric assay” was also simplified and rapid. This resulted to be an accurate technique for the quantitative counting of the polystyrene particles when compared to the well recognized cytospin assay. In the immediate future it will be interesting to extend these two assays towards the validation of the exact dose of biocompatible nanomaterials to apply in the vehicular delivery of passive and active chemical drug. Therefore, we believe that the here presented assays could become a useful tool to address many biomaterials questions, especially where the key issue is the quantitative assessment of biocompatibility issues related to the size dependence response of nanomaterials.
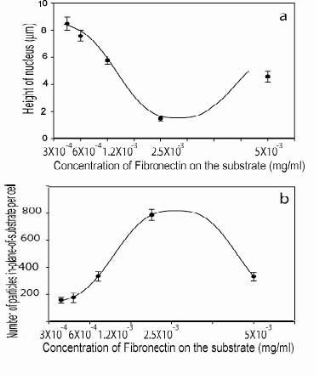
Figure 5. (a) shows the relationship between nucleus heights versus the fibronectin coating concentrations. Figure 5(b) reports the bell-shaped relationships between the in-plane measured cell-spreading versus the Fn concentrations. Optimal coating conditions were obtained at Fn concentration of 2.5 x 10⁻³ mg/ml. (Error bars =standard deviation).
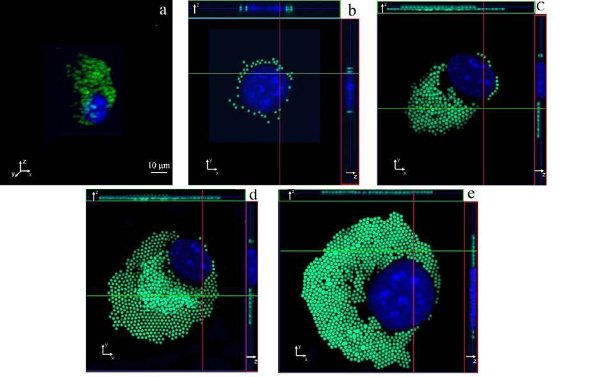
Figure 6. Comparison of 3D confocal micrographs. All images show the localization and measurement of PS particles within each cell. X-Y (main image) and Z-plane (top and right image corner) sections are shown for: (a) spherical, and (b) to (e) adherent macrophages to fibronectin-coated substrate. Z-stacks show the side view of nucleus and PS particles at top and right side of each image.

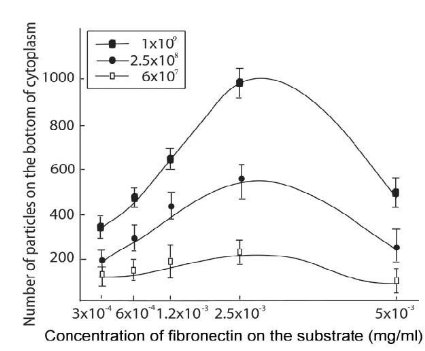
![]() Figure 7. Graph (f) shows the relationship between numbers of particles at cytoplasm bottom section (highest number of particles) and the concentrations of Fn in three different concentrations, 6x10⁷ ( ), 2.5 x10⁸ (●) and 1x10⁹ (
Figure 7. Graph (f) shows the relationship between numbers of particles at cytoplasm bottom section (highest number of particles) and the concentrations of Fn in three different concentrations, 6x10⁷ ( ), 2.5 x10⁸ (●) and 1x10⁹ (![]() ). Each bell-shaped graph reports the relationships between the measured in-plane particles, relative to the cytoplasm stack-section, and the Fn concentration. (Error bars = standard deviation).
). Each bell-shaped graph reports the relationships between the measured in-plane particles, relative to the cytoplasm stack-section, and the Fn concentration. (Error bars = standard deviation).
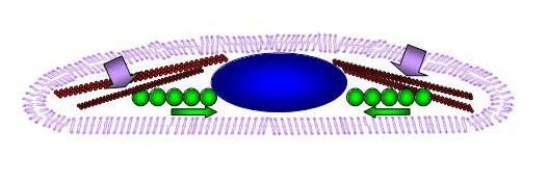 Figure 8. Mechanism of localization and storage of particles in macrophage cell: schematic illustration. Side view image of flattened macrophage comprising of nucleus, cytoskeletal structures, and particles localization enclosed inside the cellular membrane (violet contour). Nucleus in blue centered in the middle. The red scaffolding beams represent the cytoskeleton in the form of actin and microtubules. Green particles are driven through the microtubule and actin filaments to be localized and stored around the nuclear membrane where filaments forces are almost negligible.
5. Conclusion
Many studies have tackled the evaluation of the biocompatibility of nanomaterials in cell and tissue. This with the aim to quantify the benefit associated with the use of these novel vehicular carriers for drug delivery and contrast imaging applications. Therefore, it is critical to choose the most accurate and reliable technique to assess the quantitative uptake into cells. Cell cytoskeleton and cell membrane play a fundamental role for the understanding and visualization of the internalized materials. Our findings suggest that the “max-flat” assay can be a reliable and statistically significant model to measure and quantify the number of PS particle carriers internalized within each macrophage; therefore this assay results to be a suitable assay to investigate the active and passive phagocytosis mechanisms in macrophages. Finally, the max-flat assay also provides an accurate, efficient and reliable assay to measure the dose response of the all the geometrical size and shape dependent biomaterials.
Acknowledgements
We thank Dr. Shinji Takenaka and Dr. Peter Hutzler for excellent technical advice and introduction in the confocal microscopy. This work was supported by Deutsche Forschungsgemeinschaft (DFG TI696/1-1,Germany), National Council of Science and Technology (CONACYT, Mexico) and CRANN Science Foundation Ireland.
References
1. Tian T, Razansky D, Estrada G, Semmler-Behnke M, Beyerle A, Kreyling W, et al. Surface modification and size dependence in particle translocation during early embryonic development. Inhal Toxicol 2009; 21(s1): 92-6. doi:10.1080/08958370902942624
2. Lacerda L, Pastorin G, Gathercole D, Buddle J, Prato M, Bianco A, et al. Intracellular Trafficking of Carbon Nanotubes by Confocal Laser Scanning Microscopy. Advanced Materials 2007; 19: 1480-4. doi:10.1002/adma.200601412
3. Li Z, Huang P, Zhang X, Lin J, Yang S, Liu B, et al. RGD Conjugated Dendrimer-Modified Gold Nanorods for in Vivo Tumor Targeting and Photothermal Therapy. Molecular Pharmaceutics 2009.
4. Kao WJ. Evaluation of protein-modulated macrophage behavior on biomaterials: designing biomimetic materials for cellular engineering. Biomaterial 1999; 20:: 2213-21. doi:10.1016/S0142-9612(99)00152-0
5. Sirkin W, Auger M, Donat E Lipa M. Cytospins an alternative method for fine needle aspiration cytology of the breast: a study of 148 cases. Diagn Cytopathol 1995; 13: 266-9. doi:10.1002/dc.2840130316
6. Moss OR, Wong VA. When Nanoparticles Get in the Way: Impact of Projected Area on In Vivo and In Vitro Macrophage Function. Inhal Toxicol 2006; 18: 711–16. doi:10.1080/08958370600747770
7. Mühlfeld C, Mayhew TM, Gehr P, Rothen-Rutishauser B. A novel quantitative method for analyzing the distributions of nanoparticles between different tissue and intracellular compartments. J Aerosol Med 2007; 20: 395- 407. doi:10.1089/jam.2007.0624
8. Kodali VK, Roos W, Spatz JP, Curtis JE. Cell-assisted assembly of colloidal crystallites. Soft Matter 2007; 3: 251– 60. doi:10.1039/b611022n
9. Kao WJ, Lee D, Schense JC, Hubbell JA. Fibronectin modulates macrophage adhesion and FBGC formation: The role of RGD, PHSRN, and PRRARV domains. J Biomed Mater Res 2001; 55: 79-88. doi:10.1002/1097-4636 (200104)55:1<79::AID-JBM110>3.0.CO;2-Z
10. Tian F, Prina-Mello A, Estrada G, Beyerle A, Möller W, Schulz H, et al. A novel assay for the quantification of internalised nanoparticles in macrophages. Nanotoxicology 2008; 2: 232 – 42. doi:10.1080/17435390802504229
11. Brodbeck WG, Patel J, Voskerician G, Christenson E, Shive MS, Nakayama Y, et al. Biomaterial adherent macrophage apoptosis is increased by hydrophilic and anionic substrates in vivo. Proc Natl Acad Sci USA 2002; 99: 10287-92. doi:10.1073/pnas.162124199
12. Divac I and Mogensen J. Long-term retrograde labelling of neurons. Brain Res 1990; 524: 339-41.doi:10.1016/0006-8993(90)90713-L
13. Rothen-Rutishauser BM, Messerli MJ, van der Voort H, Gu¨nthert M, Wunderli Allenspach H. Deconvolution combined with digital colocalization analysis to study the spatial distribution of tight and adherens junction proteins. J Computer Assist Micros 199810: 103-11.
14. Cui D, Tian F, Ozkan , Wang M, Gao H. Effect of single wall carbon nanotubes on human HEK293 cells. Toxicology Letters 2005; 155: 73-85. doi:10.1016/j.toxlet.2004.08.015
15. Tian F, Cui D, Schwarz H, Estrada GG, Kobayashi H. Cytotoxicity of Single Wall Carbon Nanotubes on Human Fibroblasts. Toxicol In Vitro 2006; 20: 1202-12. doi:10.1016/j.tiv.2006.03.008
16. Glade N, Demongeot J and Tabony J. Microtubule self organisation by reaction-diffusion processes cause collective transport and organisation of cellular particles. BMC cell Bio 2004; 5: 23-32.
17. Reaven EP, Axline SG. Subplasmalemmal micro- filaments and microtubules in resting and phagocytizing cultivated macrophages. J Cell Biol 1973; 59: 12-27.doi:10.108 3/jcb.59.1.12
18. Jin C, Bai L, Wu H, Tian F, Guo G. Radio-sensitization of paclitaxel, etanidazole and paclitaxel etanidazole nanopar-ticles on hypoxic human tumor cells in vitro. Biomaterials2007; 28: 3724-30.doi:10.1016/j.biomaterials.2007.04.032
19. de Bruin K, Ruthardt N, von Gersdorff K, Bausinger R, Wagner E, Ogris M, Braeuchle C. Cellular dynamics of EGF receptor-targeted synthetic viruses. Mol Ther 2007; 15: 1297-1305. doi:10.1038/sj.mt.6300176
20. Dai J, Sheetz MP, Wan X, Morris CE. Membreane tension in sweeling and shrinking molluscan neurons. J Neurosci 1998; 18: 6681-92.
Received 10 November, 2009; accepted 6 December, 2009; published online 9 December, 2009.
Copyright: (c) 2009 F. Tian et al. This is an open-access article distributed under the terms of the Creative Commons Attribution License, which permits unrestricted use, distribution, and reproduction in any medium, provided the original author and source are credited.

|
Nano Biomedicine and Engineering. Copyright © Shanghai Jiao Tong University Press |
 |