Research Article
Synthesis Europium (Eu3+) Doped Zinc Oxide Nanoparticles via the Co-Precipitation Method for Photocatalytic Applications
Gemechu Barsisa 1, Abebe Belay 1 *, Gashaw Beyene 1, Cherente Seboka 2, Kusse Gudishe 3
1 Adama Science and Technology University, School of Applied Natural Science, Department of Applied Physics, Adama, Ethiopia, P.O.Box:1888.
2 Madda Walabu University, College of Natural and Computational Sciences, Department of Physics, Robe, Ethiopia, P.O.Box: 247.
3 Jinka University College of Natural and Computational Sciences, Department of Physics, Jinka, Ethiopia, P.O.Box:165.
* Corresponding author. E-mail: abebebelay96@gmail.com
Received: Sep. 2, 2021; Accepted: May 8, 2022; Published: May 9, 2022
Citation: Gemechu Barsisa, Abebe Belay, Gashaw Beyene, Cherente Seboka, and Kusse Gudishe, Synthesis Europium (Eu3+) Doped Zinc Oxide Nanoparticles via the Co-Precipitation Method for Photocatalytic Applications. Nano Biomed. Eng., 2022, 14(1): 58-70.
DOI: 10.5101/nbe.v14i1.p58-70.
Rare earth elements doped with zinc oxide nanoparticles (ZnO-NPs) have gathered a remarkable interest for their potential credence due to their high luminescent intensities. In this research, europium ion (Eu3+) doped and undoped zinc oxide nanoparticles (Eu1-xZnxO) (x=0.03, 0.06, 0.09) were synthesized via co-precipitation method. The effects of varying the concentration of the europium ion (Eu3+) on the structure and optical properties were investigated. The structural and optical properties of europium ion (Eu3+) doped and un-doped zinc oxide nanoparticles (ZnO NPs) were characterized by XRD, UV-Vis, Photoluminescence, and FT-IR Spectroscopy. The XRD results reveal the Europium ion (Eu3+) was successfully incorporated into the zinc oxide host matrix and made highly crystalline. All the synthesized samples have a hexagonal wurtzite structure. UV-Vis absorption spectra measurements revealed increasing the dopant concentration increases the energy band compared to the undoped zinc oxide nanoparticles. Photoluminescence spectra confirmed doping europium ion (Eu3+) predominantly enhances the visible emission with various series characteristics of blue and green emission compared to undoped zinc oxide nanoparticles (ZnO NPs) which exhibits the near band emission. Fourier Transform Infra Red (FTIR) spectral analysis indicated the presence of functional groups attached to Europium ion (Eu3+) doped and undoped zinc oxide nanoparticles (ZnO NPs). In addition, the presence of an additional spectrum band with increasing the concentration of dopant amount demonstrates that europium ions (Eu3+) were successfully substituted into the zinc oxide host matrix. The photocatalytic activity response is investigated using organic methylene blue (MB) as a pollutant model and dopant played the role in enhancing the photocatalytic kinetics because Eu3+ ions act as an electron acceptor to promote charge separation and photocatalytic activity. The photocatalytic activity of europium ion (Eu3+) doped zinc oxide nanoparticles has higher performance than undoped zinc oxide nanoparticles (ZnO-NPs) since the dopant has the potential candidate in minimizing the recombination probability which in turn improves the performance of photocatalytic activities which makes it suitable for the local environment.
Keywords: Zinc oxide nanoparticles, Methylene blue, Co-precipitation Method, Photocatalytic activity, Photoluminescence
Introduction
Industrial pollutants found in the environment particularly in the air and water pose serious health hazards to human life [1-2]. Hence, developing an elegant method to control water pollution consider a top priority in current research. A lot of researchers have made great efforts to explore novel materials to degrade organic and toxic pollutants of wastewater. Nanomaterials, especially metal oxides have received considerable attention over the last few years due to their distinguished performance and potential applications in various fields [1]. Among these, Zinc oxide nanoparticles have been widely used in the photocatalysis field [1-3]. They have attracted wide attention in this area due to their unique structural and functional properties which are utilized for potential applications in energy, environmental nanotechnology, and photocatalysts to convert harmful and toxic organic pollutants into harmless elements [1-6]. In the photocatalytic process, valence band holes generated by photons from the light source such as UV and visible light interact with H2O or OH- adsorbed on the catalytic surfaces to generate hydroxyl radical (∙OH), and electrons in the conduction band interact with adsorbed O2 to yield ∙O2 radical. These radicals are highly reactive and unselective oxidants [3]. Zinc oxide is a semiconductor with a wide bandgap of 3.37 eV and a large exciton binding energy of 60 meV at room temperature, including excellent chemical and thermal stability [3], safe and biocompatible [4]. It was established to initiate in assorted applications such as UV photodetectors [5] optoelectronics [6], solar cells [7], laser technology [8], light-emitting diodes (LEDs) [9], surface acoustic wave’s device [10], antimicrobial and antifungal activity [11], luminescent, gas sensor devices [12], optical coatings [13], chemical sensor [14], acaricidal antidiabetic, photonic crystals [15], gene delivery [16], and photovoltaics [17]Moreover, it has also exhibited better performance to eliminate organic pollutants in water such as methylene blue (MB), acridine orange, rhodamine B, methylene orange, and polyvinyl alcohol in aqueous solution [1-2,13-14]. Zinc oxide nanoparticles (ZnO-NPs) have been synthesized using different techniques. The synthesis techniques are hydrothermal method [12], co-precipitation [18], pulsed laser deposition (PLD) [7], sol-gel method [19], microwave-assisted combustion, and solid-state reaction [20], Pulsed laser ablation in liquids (PLAL) [15]. Among the above techniques, co-precipitation is a promising option for the synthesis with large-scale production of zinc oxide nanoparticles (ZnO-NPs) [10]. On the other hand, this technique is a promising technique that is not expensive, easy to manipulate, easy to control mixing rate, easy to adjust dopant concentrations. One of the most fundamental, fastidious, and efficient ways to alter the peculiar properties of semiconducting materials is through the doping method. The doping of a foreign atom into an extremely pure semiconductor greatly affects the basic physical properties of the resulting material. The induced enhancement of photocatalytic activity noticed in the specified metal through doping was found to be remarkable. Doping with selective elements offers an effective method to modify the optical, structural properties of zinc oxide nanoparticles (ZnO NPs), which is a crucial role for applications[4]. The rare earth elements doped zinc oxide nanoparticles are the prominent strategy to improve the properties of photocatalytic efficiency [3-5]. Rare earth elements such as Ce, Dy, La, Nd, Gd, and Sm doped zinc oxide nanoparticles (ZnO-NPs) are widely used for the photodegradation of organic pollutants [5-6]. Such kind of doping results in the variation of surface area and the incorporation of dopant ions generates lattice defects and modifies bandgap. The rare earth elements doped with zinc oxide nanoparticles have been used to improve the properties and they are exhaustively used in optoelectronic devices to vary and optimize the properties of the materials. Rare earth elements ions generally have high luminescent intensity because their 4f- intra shell transitions can generate narrow and intense emission lines [18-19]. Among rare earth elements, europium ion (Eu3+) displays a robust release due to the 4f– 4f movement of electrons from top to bottom level. The 4f atomic orbitals of europium ion (Eu3+) are surrounded by outer 6s, 5p, and 5d atomic orbitals. These orbitals act as a shield for 4f orbitals and protect them from the coupling of surrounding legends [22]. Therefore, in this research, europium ion (Eu3+) doped zinc oxide nanoparticles (ZnO NPs) via the co-precipitation method were synthesized. The influence of concentration on their optical, structural, and photoluminescence properties and the response of their photocatalytic activity for the methylene blue (MB) of the as-synthesized samples were investigated and discussed in detail.
Experimental
The chemicals required for synthesizing zinc oxide nanoparticles (ZnO-NPs) are zinc nitrate hexahydrate (![]() ) (Cosmic Chemicals Pvt. Ltd., New Delhi, India, assay;
) (Cosmic Chemicals Pvt. Ltd., New Delhi, India, assay; ![]() 99.6 %), europium (III) nitrate pentahydrate (
99.6 %), europium (III) nitrate pentahydrate (![]() ) (Sigma, Aldrich, USA, assay;
) (Sigma, Aldrich, USA, assay; ![]() 99.9
99.9![]() ) and sodium hydroxide (NaOH) (Alpha Chemica, India). Ethanol, distilled water (DIW) and dimethyl sulfoxide (DMSO) (Unichem, India, assay;
) and sodium hydroxide (NaOH) (Alpha Chemica, India). Ethanol, distilled water (DIW) and dimethyl sulfoxide (DMSO) (Unichem, India, assay; ![]() 99%) have been used as solvents. The photocatalytic responses of synthesized nanoparticles were evaluated using organic dye methylene blue (MB). All solvents used in this experiment were analytical grade and used without any further purification.
99%) have been used as solvents. The photocatalytic responses of synthesized nanoparticles were evaluated using organic dye methylene blue (MB). All solvents used in this experiment were analytical grade and used without any further purification.
2.1. Synthesis of europium ion (Eu3+) doped and Un-doped zinc oxide nanoparticles (ZnO-NPs)
The synthesis of europium ion (Eu3+) doped zinc oxide nanoparticles (![]() ) (x = 0.00, 0.03, 0.06, 0.09) were prepared via co-precipitation method using zinc nitrate hexahydrate as a precursor, europium nitrate pentahydrate as a dopant agent, and sodium hydroxide (NaOH) as a precipitating agent. 0.57 M of zinc nitrate hexahydrate and the required amount of europium nitrate pentahydrate (X = 0.03 (0.619 gm), x = 0.06 (1.277 gm) and x = 0.09 (1.979 gm)) were dissolved in 100 ml of deionized water. Also, 1 M of sodium hydroxide was dissolved in 100 ml of deionized water in a separate beaker. The aqueous solutions of NaOH were added dropwise to the above solutions containing zinc nitrate hexahydrate and europium nitrate pentahydrate and homogenously stirred by a magnetic stirrer for 40 minutes at room temperature. The prepared solutions were kept for 3 hrs for the precipitation to occur. The solutions were filtered with a What-man-1 filter paper of 110 mm size and rinsed several times using distilled water and ethanol to remove impurities. After filtration, the residue was collected from filter paper and dried in a hot air oven at 80
) (x = 0.00, 0.03, 0.06, 0.09) were prepared via co-precipitation method using zinc nitrate hexahydrate as a precursor, europium nitrate pentahydrate as a dopant agent, and sodium hydroxide (NaOH) as a precipitating agent. 0.57 M of zinc nitrate hexahydrate and the required amount of europium nitrate pentahydrate (X = 0.03 (0.619 gm), x = 0.06 (1.277 gm) and x = 0.09 (1.979 gm)) were dissolved in 100 ml of deionized water. Also, 1 M of sodium hydroxide was dissolved in 100 ml of deionized water in a separate beaker. The aqueous solutions of NaOH were added dropwise to the above solutions containing zinc nitrate hexahydrate and europium nitrate pentahydrate and homogenously stirred by a magnetic stirrer for 40 minutes at room temperature. The prepared solutions were kept for 3 hrs for the precipitation to occur. The solutions were filtered with a What-man-1 filter paper of 110 mm size and rinsed several times using distilled water and ethanol to remove impurities. After filtration, the residue was collected from filter paper and dried in a hot air oven at 80![]() for 19 hrs and calcinated in a muffle furnace at 500
for 19 hrs and calcinated in a muffle furnace at 500![]() for
for ![]() hrs. Similar procedures were applied to synthesize un-doped zinc oxide nanoparticles (ZnO-NPs).
hrs. Similar procedures were applied to synthesize un-doped zinc oxide nanoparticles (ZnO-NPs).
2.2. Procedures for the photocatalytic degradation of methylene blue (MB)
The photocatalytic activities of europium ion (Eu3+) doped and un-doped zinc oxide nanoparticles (ZnO-NPs) were investigated by measuring the degradation of methylene blue (MB) in an aqueous solution under UV radiation. The photocatalytic reactions were carried out in a transparent spherical glass reactor with 100 ml capacity. 0.05 g of europium ion (Eu3+) doped and un-doped zinc oxide nanoparticles (ZnO-NPs) were poured into 100 ml of 10-ppm methylene blue (MB) aqueous solutions stirred using an ultrasonic bath for 30 min to achieve the adsorption/desorption equilibrium of methylene blue on the surface of photocatalysts. During the period of irradiation, the reaction mixture was continuously stirred at room temperature and 5 ml aliquots were withdrawn from the solution at time intervals of 15 min until the final irradiation time of 60 min was achieved. After the completion of each irradiation time, the mixtures were centrifuged at 3000 rpm for 10 min to separate the solid part from the solutions. Finally, the solutions were subjected to the absorption spectrum measurements using the UV-Visible (UV-3600Plus Series) spectrophotometer in the wavelength of 200-800 nm. To determine the oxidation efficiency of methylene blue (MB) Eq, 1 [30] were applied.
Photodegradation efficiency (%)  , (1)
, (1)
2.4 Characterization techniques
The X-ray diffraction pattern of ZnO nanoparticles was recorded using (XRD-7000 X-RAY DIFFRACTOMETER MAXIma, SHIMADZU Corporation, Japan) equipped with Cu-Kα radiation (λ = 0.154056 nm) operates at a voltage of 40 kV, applied current of 30 mA in the scanning speed of 3.000 degrees per minutes, resolution of 0.1 nm, and steps size of 0.02![]() . The data were scanned at a range of
. The data were scanned at a range of![]() . It is used to determine the plane spacing, crystalline size, lattice parameter, bond length, positional parameters, dislocation density, and micro-strain of europium ion (Eu3+) doped and un-doped zinc oxide nanoparticles (ZnO-NPs) using Eqs. (2-14). The average crystallite sizes (D) of the synthesized samples were calculated from XRD spectra using Debye-Scherrer Eq. 2 [23].
. It is used to determine the plane spacing, crystalline size, lattice parameter, bond length, positional parameters, dislocation density, and micro-strain of europium ion (Eu3+) doped and un-doped zinc oxide nanoparticles (ZnO-NPs) using Eqs. (2-14). The average crystallite sizes (D) of the synthesized samples were calculated from XRD spectra using Debye-Scherrer Eq. 2 [23].
![]() (2)
(2)
The plane spacing (d) calculated from lattice parameters (‘![]() ’ and ‘
’ and ‘![]() ’) for the wurtzite hexagonal structure of zinc oxide according to Eq. (3) [24];
’) for the wurtzite hexagonal structure of zinc oxide according to Eq. (3) [24];
 , (3)
, (3)
with the first-order approximation (n = 1) Eq. 3 above can be re-written as Eq. 4 [25].
 . (4)
. (4)
In the case of the wurtzite phase, the lattice parameters ‘![]() ’ and ‘
’ and ‘![]() ’ of zinc oxide can be calculated using Eqs. (5-6) [26];
’ of zinc oxide can be calculated using Eqs. (5-6) [26];
![]() . (5)
. (5)
![]() (6)
(6)
Another method to authenticate the presence of dopant concentration is estimating the presence of the bond length (L). The bond lengths are calculated using the relation of Eq. (7) [27].
 (7)
(7)
The positional parameter in the wurtzite structure is determined by the amount each atom gets displaced for the ‘c’ axis given by Eq. (8) [28].
![]() (8)
(8)
where the symbols used in Eq. (2-7) represent, λ is the incident X-ray wavelength, β is the angular peak width at half maximum (FWHM) in radians, and θ is the position of Bragg’s diffraction angle. The dislocation density (δ) is a measure of the number of defects and vacancies in the crystal, which can be determined from the crystallite size (![]() ) using the relation in Eq, 9 [23].
) using the relation in Eq, 9 [23].
![]() (9)
(9)
The lattice expansion is quantified by the measurement of micro-strain which is given by Eq . (9) [22].
![]() (10)
(10)
The unit cell volumes (V) for the hexagonal system were obtained using Eq.(11) [24].
![]() (11)
(11)
Atomic packing fraction (APF) has been calculated using Eq. (12) [29].
![]() (12)
(12)
The bandgap energy can be determined using Eq. (12) [30]:
![]() , (13)
, (13)
where ![]() is the bandgap energy
is the bandgap energy![]() ,
, ![]() is Planck’s constant,
is Planck’s constant, ![]() is the speed of light, and λ is the wavelength of absorption spectra. The energy bandgap
is the speed of light, and λ is the wavelength of absorption spectra. The energy bandgap ![]() is determined from a Tauc-plot using Eq. (13) [31]
is determined from a Tauc-plot using Eq. (13) [31]
![]() (14)
(14)
where ![]() is absorption coefficient,
is absorption coefficient, ![]() is the Plank’s constant,
is the Plank’s constant, ![]() is the frequency of light radiation, and
is the frequency of light radiation, and ![]() is the bandgap energy where ‘
is the bandgap energy where ‘![]() ’ takes the value of 0.5 allowed direct transition. The UV/Vis absorption spectra of zinc oxide nanoparticles (ZnO-NPs) were recorded using UV/Vis spectroscopy (double beam spectrophotometer (An ISO 9001 model, Maalab, India) in the wavelength region of 200-600 nm. The samples were dissolved in DMSO and its absorbance is measured using a 1cm quartz cuvette at room temperature. The ASCII files of the measured spectra were collected by a computer interfaced with the instrument. The absorption spectra were analyzed using Origin 8 software. The emission spectra were measured with Fluorescence Spectroscopy (Cary Eclipse, Fluorescence Spectrophotometer, Agilent, Malaysia) at room temperature. The excitation wavelengths of the samples were monitored at 325, 380, and 394 nm. The slit width of the instrument was set at 10 nm. The functional groups attached to the nanoparticles were also measured by Fourier Transform Infra-Red Spectroscopy (Perkin Elmer, Spectrum 65 FT-IR) in the wavenumber region of 4000-400 cm-1. The FT-IR spectra of NPs were analyzed putting the powder of the samples on the KBr pellets. The photo-degradation efficiency of europium ion (Eu3+) doped and undoped zinc oxide nanoparticles (ZnO-NPs) were evaluated by the degradation of methylene blue in aqueous solutions under UV light in the time interval of 0-60 min with the range of 15 min and finally, the absorption spectra were determined by scanning the samples in the wavelength region of 200-800 nm.
’ takes the value of 0.5 allowed direct transition. The UV/Vis absorption spectra of zinc oxide nanoparticles (ZnO-NPs) were recorded using UV/Vis spectroscopy (double beam spectrophotometer (An ISO 9001 model, Maalab, India) in the wavelength region of 200-600 nm. The samples were dissolved in DMSO and its absorbance is measured using a 1cm quartz cuvette at room temperature. The ASCII files of the measured spectra were collected by a computer interfaced with the instrument. The absorption spectra were analyzed using Origin 8 software. The emission spectra were measured with Fluorescence Spectroscopy (Cary Eclipse, Fluorescence Spectrophotometer, Agilent, Malaysia) at room temperature. The excitation wavelengths of the samples were monitored at 325, 380, and 394 nm. The slit width of the instrument was set at 10 nm. The functional groups attached to the nanoparticles were also measured by Fourier Transform Infra-Red Spectroscopy (Perkin Elmer, Spectrum 65 FT-IR) in the wavenumber region of 4000-400 cm-1. The FT-IR spectra of NPs were analyzed putting the powder of the samples on the KBr pellets. The photo-degradation efficiency of europium ion (Eu3+) doped and undoped zinc oxide nanoparticles (ZnO-NPs) were evaluated by the degradation of methylene blue in aqueous solutions under UV light in the time interval of 0-60 min with the range of 15 min and finally, the absorption spectra were determined by scanning the samples in the wavelength region of 200-800 nm.
Results and Discussion
From X-ray diffraction crystalline size and other basic physical properties of europium ion (Eu3+) doped and un-doped zinc oxide nanoparticles (ZnO-NPs) were analyzed. Fig. 1 depicts the X-ray diffraction patterns of europium ion (Eu3+) doped and un-doped zinc oxide nanoparticles (ZnO-NPs). The diffraction peaks were observed at 2θ = 31.8150![]() , 34.4768
, 34.4768![]() , 36.3024
, 36.3024![]() , 47.5913
, 47.5913![]() , 56.6409
, 56.6409![]() , 62.9131
, 62.9131![]() , 63.2033
, 63.2033![]() , 66.4186
, 66.4186![]() , 67.9977
, 67.9977![]() , 69.1311
, 69.1311![]() , 77.0099
, 77.0099![]() indexed to (100), (002), (101), (102), (110), (103), (200), (112), (201), and (202) planes. The diffraction peaks indicated the synthesized NPs have wurtzite structure with hexagonal phase as fitted to Joint Committee on Powder Diffraction Standard (JCPDS card No. 36-1451, space group P63mc, 186) [23]. Moreover, the XRD pattern depicts sharp and intense peaks indicating that the prepared samples were highly crystalline. It is also noted that no other secondary phases from the XRD diffraction patterns were observed and ascribed the successful incorporation of europium ion (Eu3+) into the host zinc oxide crystal lattice. Similar trends have also been observed in the literature [12, 20]. The shifts to lower angle of the diffraction peaks for europium ion (Eu3+) doped zinc oxide nanoparticles (ZnO- NPs) was mainly caused due to dopant of Eu3+ substituted Zn2+ ion as result distortion in the host of zinc oxide lattice crystal were observed. Fig 2a shows as the doping concentration of europium ion (Eu3+) is increased the corresponding most intense peak (101) of XRD patterns shifted towards the lower angle. Similar trends were reported by doping rare earth elements with ZnO NPs in the work of [32]. The reason for the shift in peak intensity is due to the ionic radius mismatch that occurred between Eu3+ and that of Zn2+, respectively. The ionic radius for Eu3+ is 0.095 nm and that of Zn2+ is 0.074 nm, respectively. Meanwhile, the strain has been developed due to the effect of different ionic radii of the respective metal ions. The decrease in intensity of zinc oxide diffraction peaks indicates that the lattice distortion induced at higher europium ion (Eu3+) concentrations deteriorates the crystallization of zinc oxide. Similar results were also broadly reported in the literature [20]. Table 1 emphasizes the calculated values of the crystallite size, micro-strain, and dislocation density for europium ion (Eu3+) doped and un-doped zinc oxide nanoparticles (ZnO-NPs), respectively. The crystallite size of un-doped zinc oxide nanoparticles (ZnO- NPs) is estimated to be 39.4 nm. The crystallite size of doped zinc oxide nanoparticles (ZnO- NPs) increases as compared to un-doped zinc oxide nanoparticles (ZnO-NPs as shown in Table 1. The increase in the crystallite size is due to the distortion of zinc oxide lattice by the addition of foreign impurities i.e.; europium ion (Eu3+) into host lattice sites. Fig. 2b shows the increase in crystalline size when the concentration of europium ion (Eu3+) increase is attributed to mainly the replacement of Zn2+ by Eu3+ ions in the host of zinc oxide crystal lattice. Recently, Ntwaeaborwa et al. [18], have investigated the increase in crystal size as the concentration increases. On the other hand, reduction in the micro-strain and dislocation observed as the concentration of the sample is being increased from (x = 0.00 to x=0.09 with an increment x rate of 0.03) is mainly due to the compression strain in the crystal lattice of the particle size as shown Fig 3. Structural parameters such as lattice parameters, atomic packing factor, the volume of the unit cell, positional parameters, and bond length of europium ion (Eu3+) doped and un-doped zinc oxide nanoparticles (ZnO-NPs calculated for different concentrations are tabulated in Table 2. The lattice parameters of semiconductors usually depend on the foreign atoms, defects, and the difference in ionic radii for the substituted matrix ions. The increasing of the concentrations of europium ion (Eu3+) doped zinc oxide nanoparticles (ZnO-NPs causes the major change in the lattice parameters, atomic packing factor, volume of the unit cell, positional parameters, and bond length in all aspects. As the concentration of the europium ion (Eu3+) is increased from (x = 0.00 to x=0.09 with an increment x rate of 0.03), the prominent structural parameters of doped zinc oxide nanoparticles (ZnO-NPs) significantly change from the conventional bulk counterpart of zinc oxide nanoparticles (ZnO-NPs). The variations of lattice parameters such as ‘
indexed to (100), (002), (101), (102), (110), (103), (200), (112), (201), and (202) planes. The diffraction peaks indicated the synthesized NPs have wurtzite structure with hexagonal phase as fitted to Joint Committee on Powder Diffraction Standard (JCPDS card No. 36-1451, space group P63mc, 186) [23]. Moreover, the XRD pattern depicts sharp and intense peaks indicating that the prepared samples were highly crystalline. It is also noted that no other secondary phases from the XRD diffraction patterns were observed and ascribed the successful incorporation of europium ion (Eu3+) into the host zinc oxide crystal lattice. Similar trends have also been observed in the literature [12, 20]. The shifts to lower angle of the diffraction peaks for europium ion (Eu3+) doped zinc oxide nanoparticles (ZnO- NPs) was mainly caused due to dopant of Eu3+ substituted Zn2+ ion as result distortion in the host of zinc oxide lattice crystal were observed. Fig 2a shows as the doping concentration of europium ion (Eu3+) is increased the corresponding most intense peak (101) of XRD patterns shifted towards the lower angle. Similar trends were reported by doping rare earth elements with ZnO NPs in the work of [32]. The reason for the shift in peak intensity is due to the ionic radius mismatch that occurred between Eu3+ and that of Zn2+, respectively. The ionic radius for Eu3+ is 0.095 nm and that of Zn2+ is 0.074 nm, respectively. Meanwhile, the strain has been developed due to the effect of different ionic radii of the respective metal ions. The decrease in intensity of zinc oxide diffraction peaks indicates that the lattice distortion induced at higher europium ion (Eu3+) concentrations deteriorates the crystallization of zinc oxide. Similar results were also broadly reported in the literature [20]. Table 1 emphasizes the calculated values of the crystallite size, micro-strain, and dislocation density for europium ion (Eu3+) doped and un-doped zinc oxide nanoparticles (ZnO-NPs), respectively. The crystallite size of un-doped zinc oxide nanoparticles (ZnO- NPs) is estimated to be 39.4 nm. The crystallite size of doped zinc oxide nanoparticles (ZnO- NPs) increases as compared to un-doped zinc oxide nanoparticles (ZnO-NPs as shown in Table 1. The increase in the crystallite size is due to the distortion of zinc oxide lattice by the addition of foreign impurities i.e.; europium ion (Eu3+) into host lattice sites. Fig. 2b shows the increase in crystalline size when the concentration of europium ion (Eu3+) increase is attributed to mainly the replacement of Zn2+ by Eu3+ ions in the host of zinc oxide crystal lattice. Recently, Ntwaeaborwa et al. [18], have investigated the increase in crystal size as the concentration increases. On the other hand, reduction in the micro-strain and dislocation observed as the concentration of the sample is being increased from (x = 0.00 to x=0.09 with an increment x rate of 0.03) is mainly due to the compression strain in the crystal lattice of the particle size as shown Fig 3. Structural parameters such as lattice parameters, atomic packing factor, the volume of the unit cell, positional parameters, and bond length of europium ion (Eu3+) doped and un-doped zinc oxide nanoparticles (ZnO-NPs calculated for different concentrations are tabulated in Table 2. The lattice parameters of semiconductors usually depend on the foreign atoms, defects, and the difference in ionic radii for the substituted matrix ions. The increasing of the concentrations of europium ion (Eu3+) doped zinc oxide nanoparticles (ZnO-NPs causes the major change in the lattice parameters, atomic packing factor, volume of the unit cell, positional parameters, and bond length in all aspects. As the concentration of the europium ion (Eu3+) is increased from (x = 0.00 to x=0.09 with an increment x rate of 0.03), the prominent structural parameters of doped zinc oxide nanoparticles (ZnO-NPs) significantly change from the conventional bulk counterpart of zinc oxide nanoparticles (ZnO-NPs). The variations of lattice parameters such as ‘![]() ’ and ‘
’ and ‘![]() ’ are due to the shift of diffraction peak positions, which may depend on the difference in ionic radius between the main element and the dopant element. The bond length values are found to increase with the increase in europium ion (Eu3+) concentrations as presented in Table 2, due to the effect of the replacement of Zn2+ ions in zinc oxide crystal lattice. As shown in Fig. 3 when the concentration of europium ion (Eu3+) increases, the micro-strain, and the dislocation density decrease. This is elegant method also varies the lattice parameters of materials as shown in Fig 4.
’ are due to the shift of diffraction peak positions, which may depend on the difference in ionic radius between the main element and the dopant element. The bond length values are found to increase with the increase in europium ion (Eu3+) concentrations as presented in Table 2, due to the effect of the replacement of Zn2+ ions in zinc oxide crystal lattice. As shown in Fig. 3 when the concentration of europium ion (Eu3+) increases, the micro-strain, and the dislocation density decrease. This is elegant method also varies the lattice parameters of materials as shown in Fig 4.
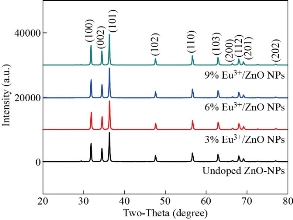
Fig. 1 XRD patterns of un-doped, Zn0.97Eu0.03O, Zn0.94Eu0.06O, and Zn0.91Eu0.09O NPs.
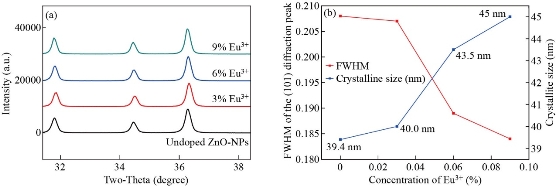
Fig. 2 Peak shift analysis of (a) un-doped, Zn0.97Eu0.03O, Zn0.94Eu0.06O, and Zn0.91Eu0.09O NPs; (b) plot of full width at half maximum (FWHM) and crystalline size for the most intense diffraction peak (101).
Table 1 Variation of crystallite size, micro-strain, dislocation density, full width at half maximum, plane spacing of un-doped, Zn0.97Eu0.03O, Zn0.94Eu0.06O, and Zn0.91Eu0.09O NPs
|
S. No |
Concentrations of Eu3+ (%) |
( |
D101 (nm) |
d101( |
FWHM ( |
Micro strain (10-4) |
(lines per m2) |
|
1 |
0.00 |
36.3024 |
39.4 |
2.47267 |
0.20780 |
8.620 |
6.442E+14 |
|
2 |
0.03 |
36.3431 |
40.0 |
2.46999 |
0.20700 |
8.580 |
6.250E+14 |
|
3 |
0.06 |
36.3168 |
43.5 |
2.47172 |
0.18900 |
7.830 |
5.285E+14 |
|
4 |
0.09 |
36.2956 |
45.0 |
2.47312 |
0.18390 |
7.620 |
4.938E+14 |
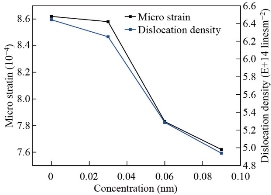
Fig. 3 Effect of concentration of europium ion (Eu3+) on the structure of nanoparticles associated with micro-strain and dislocation density.
Table 2 Variation of structural parameters of un-doped, Zn0.97Eu0.03O, Zn0.94Eu0.06O, and Zn0.91Eu0.09O NPs
|
S. No |
Lattice parameters (nm) |
APF (c/a) |
Volume V (Å) 3 |
Positional parameter (u) |
Bond length (Zn–O) (L) (Å) |
(APF) (%) |
|
|
a |
c |
||||||
|
1 |
0.3245 |
0.5218 |
1.605 |
47.730 |
0.3790 |
1.977 |
75.16 |
|
2 |
0.3241 |
0.5193 |
1.602 |
47.240 |
0.3793 |
1.973 |
75.43 |
|
3 |
0.3243 |
0.5197 |
1.603 |
47.330 |
0.3797 |
1.974 |
75.42 |
|
4 |
0.3245 |
0.5200 |
1.602 |
47.420 |
0.3798 |
1.975 |
75.40 |
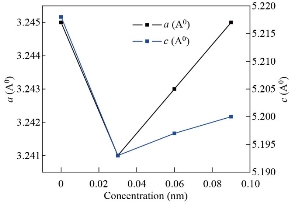
Fig. 4 Effect of concentration of europium ion (Eu3+) on the lattice parameters.
Fig. 5 depicts the UV-Vis absorption spectra of europium ion (Eu3+) doped and un-doped zinc oxide nanoparticles (ZnO-NPs). With further increases in the europium ion (Eu3+) to the higher concentrations, there are small shifts of wavelength. The same results are confirmed in [33]. The absorption peaks for doped and un-doped zinc oxide nanoparticles (ZnO-NPs) are due to the electron transits from the valance band to the conduction band. The bandgap energy for un-doped zinc oxide nanoparticles (ZnO-NPs) and europium ion (Eu3+) doped zinc oxide nanoparticles (ZnO-NPs) were calculated and tabulated in Table 3. It is also noted that when the concentrations of europium ion (Eu3+) increased from (x = 0.00 to x=0.09 with an increment x rate of 0.03) the bandgap energy increased from 3.26 -3.28 eV. The results demonstrated that the europium ion (Eu3+) doping with varying concentrations has had a role in enhancing the bandgap energy of the synthesized materials. Fig. 6 shows, the Taucs plot of un-doped zinc oxide nanoparticles (ZnO-NPs) and europium ion (Eu3+) doped zinc oxide nanoparticles. The ![]() plot as a function of photon energy
plot as a function of photon energy ![]() is displayed in the inset of Fig. 6. The values of the bandgap energy are estimated from the extrapolation of a tangent line to the energy axis. Previous research reports indicated a small increase in the values of bandgap energy with a further increase in the doping concentration [34].
is displayed in the inset of Fig. 6. The values of the bandgap energy are estimated from the extrapolation of a tangent line to the energy axis. Previous research reports indicated a small increase in the values of bandgap energy with a further increase in the doping concentration [34].
Table 3 Calculated bandgap energy for un-doped, Zn0.97Eu0.03O, Zn0.94Eu0.06O, and Zn0.91Eu0.09O NPs, respectively
|
S.No |
Concentrations (%) |
Maximum wavelength (λmax) (nm) |
Band gap energy (Eg) (eV) |
|
1 |
0.00 |
381 |
3.26 |
|
2 |
0.03 |
379 |
3.27 |
|
3 |
0.06 |
380 |
3.26 |
|
4 |
0.09 |
378 |
3.28 |
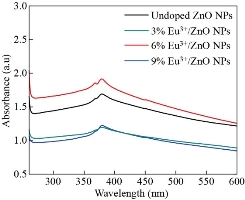
Fig. 5 UV-Vis absorbance spectra of un-doped, Zn0.97Eu0.03O, Zn0.94Eu0.06O, and Zn0.91Eu0.09O NPs .
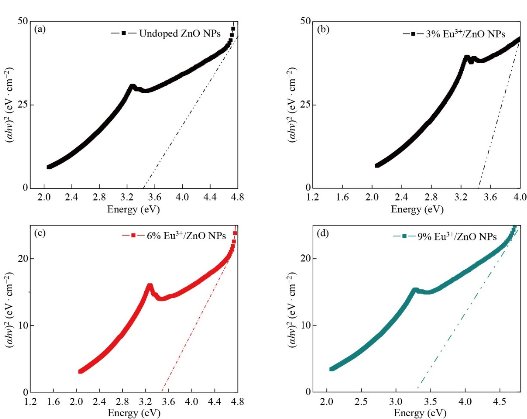
Fig. 6 Tauc’s plots drawn ![]() versus the photon energy
versus the photon energy ![]() of (a) un-doped,(b) Zn0.97Eu0.03O, (c) Zn0.94Eu0.06O, and (d) Zn0.91Eu0.09O NPs, respectively.
of (a) un-doped,(b) Zn0.97Eu0.03O, (c) Zn0.94Eu0.06O, and (d) Zn0.91Eu0.09O NPs, respectively.
Photoluminescence (PL) spectra of europium ion (Eu3+) doped and un-doped zinc oxide nanoparticles (ZnO-NPs) were obtained by exciting the samples at the wavelength of 325 nm, 380 nm and 394 nm, respectively. Fig 7 a-c shows the corresponding emission spectra. The sharp peak emission at 388 nm is attributed to the band -to- band transitions known as near band edge emission (NBE). For the excitation wavelength of 325 nm, the broad emission peak around 418 nm were observed in europium ion (Eu3+) doped zinc oxide nanoparticles (ZnO-NPs) attributed to the radiative recombination of exciton (exciton emission) i.e.; electronic transitions from the conduction band to the valence band. Similar trends are also observed in the literature [17, 32-33]. An increase in intensity and broad emission spectra were observed for europium ion (Eu3+) doping zinc oxide nanoparticles (ZnO-NPs) when the sample was excited at 325 nm. When the concentration of europium ion (Eu3+) is increased from (x = 0.00 to x=0.09 with an increment x rate of 0.03) shifts in peaks position is occurred indicating that the photoluminescence emission predominantly depends on the concentration of europium ion (Eu3+) doped zinc oxide nanoparticles (ZnO-NPs). From Fig. 7 a-c strong emission peak is observed at 426 nm (![]() 2.913 eV) and 419 nm (
2.913 eV) and 419 nm (![]() 2.961 eV) are due to transitions of 7F1
2.961 eV) are due to transitions of 7F1 ![]() 5D3 and 7F0
5D3 and 7F0 ![]() 5D3 for an excitation wavelength of 380 nm and 394 nm may be due to the deep-level defect states in the europium ion (Eu3+) doped zinc oxide nanoparticles (ZnO-NPs) attributed to oxygen vacancies and zinc interstitials. On doping of europium ion (Eu3+) doped zinc oxide nanoparticles (ZnO-NPs) the peak intensity decreased when the samples were excited at 380 nm than the un-doped zinc oxide nanoparticles (ZnO-NPs). It is also imperative that the strain developed in the sample due to doping agents plays a major role in shifting the photoluminescence emission peak. In Fig.7b series characteristics of emissions such as violet emission (431 nm) (
5D3 for an excitation wavelength of 380 nm and 394 nm may be due to the deep-level defect states in the europium ion (Eu3+) doped zinc oxide nanoparticles (ZnO-NPs) attributed to oxygen vacancies and zinc interstitials. On doping of europium ion (Eu3+) doped zinc oxide nanoparticles (ZnO-NPs) the peak intensity decreased when the samples were excited at 380 nm than the un-doped zinc oxide nanoparticles (ZnO-NPs). It is also imperative that the strain developed in the sample due to doping agents plays a major role in shifting the photoluminescence emission peak. In Fig.7b series characteristics of emissions such as violet emission (431 nm) (![]() 2.879 eV), blue emission (
2.879 eV), blue emission (![]() 485.9 nm) (
485.9 nm) (![]() 2.554 eV), and green emission (519 nm) (
2.554 eV), and green emission (519 nm) (![]() 2.400 eV) were observed. The peak intensity becomes increased while the concentration of europium ion (Eu3+) doped zinc oxide nanoparticles (ZnO-NPs) is increased at the excitation wavelength of 394 nm. Similarly in Fig. 7c series characteristics of emissions such as violet emission (437 nm) (2.840 eV), blue emission (486 nm) (
2.400 eV) were observed. The peak intensity becomes increased while the concentration of europium ion (Eu3+) doped zinc oxide nanoparticles (ZnO-NPs) is increased at the excitation wavelength of 394 nm. Similarly in Fig. 7c series characteristics of emissions such as violet emission (437 nm) (2.840 eV), blue emission (486 nm) (![]() 2.553 eV), and green emission (536 nm) (
2.553 eV), and green emission (536 nm) (![]() 2.315 eV) was observed when excited at 394 nm. Those various series characteristics were observed due to the doping effect of europium ion (Eu3+) into the host zinc oxide nanoparticles (ZnO-NPs). Further, the blue emissions have arisen as a result of the recombination of zinc interstitial energy level to zinc vacancy energy level and that of green emission is occurred due to the recombination of singly ionized oxygen vacancies. Certain groups have also previously reported the same trends [22][35]. The emission peaks observed at 485 nm, 518 nm, 486 nm, and 536 nm were found to be extremely weak for an excitation wavelength of 389 nm and 394 nm, respectively. The series of the characteristics of europium ion (Eu3+) emission centered at 485 nm and 518 nm, respectively are ascribed mainly due to intra 4f transitions of 7F0
2.315 eV) was observed when excited at 394 nm. Those various series characteristics were observed due to the doping effect of europium ion (Eu3+) into the host zinc oxide nanoparticles (ZnO-NPs). Further, the blue emissions have arisen as a result of the recombination of zinc interstitial energy level to zinc vacancy energy level and that of green emission is occurred due to the recombination of singly ionized oxygen vacancies. Certain groups have also previously reported the same trends [22][35]. The emission peaks observed at 485 nm, 518 nm, 486 nm, and 536 nm were found to be extremely weak for an excitation wavelength of 389 nm and 394 nm, respectively. The series of the characteristics of europium ion (Eu3+) emission centered at 485 nm and 518 nm, respectively are ascribed mainly due to intra 4f transitions of 7F0 ![]() 5D2 and 7F0
5D2 and 7F0 ![]() 5D1 and for 486 and 536 nm are 7F0
5D1 and for 486 and 536 nm are 7F0 ![]() 5D2 and 7F1
5D2 and 7F1 ![]() 5D1, respectively. The visible emission could be attributed due to the various kinds of intrinsic defects such as defect states, zinc interstitials, oxygen vacancies and zinc vacancies [36]. More compactly, when the concentration of dopant agent increased from (x = 0.00 to x=0.09 with an increment x rate of 0.03), europium ion (Eu3+) doping had a significant impact on the intensity, peak position, and emission spectra of bands as shown in Fig 7a-c [20] [34].
5D1, respectively. The visible emission could be attributed due to the various kinds of intrinsic defects such as defect states, zinc interstitials, oxygen vacancies and zinc vacancies [36]. More compactly, when the concentration of dopant agent increased from (x = 0.00 to x=0.09 with an increment x rate of 0.03), europium ion (Eu3+) doping had a significant impact on the intensity, peak position, and emission spectra of bands as shown in Fig 7a-c [20] [34].
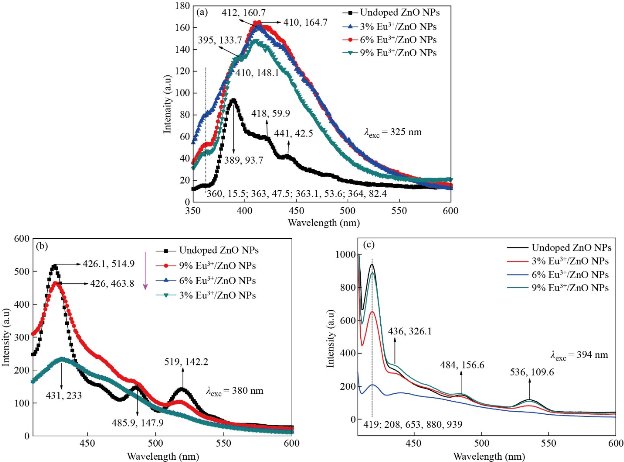
Fig. 7 Photoluminescence emission spectra un-doped, Zn0.97Eu0.03O, Zn0.94Eu0.06O, and Zn0.91Eu0.09O NPs excited at a wavelength of (a) 325 nm, (b) 380 nm, and (c) 394 nm, respectively at room temperature.
The FT-IR spectra of both europium ion (Eu3+) doped and un-doped zinc oxide nanoparticles (ZnO-NPs) were recorded at room temperature in the range of 400 cm-1 -4000 cm-1 with the resolution of 4 cm-1 using the KBr pellets. In Fig. 8 the absorption peaks were observed at 3412, 2922, 1381, 841, and 566 cm-1 for europium ion (Eu3+) doped and un-doped zinc oxide nanoparticles (ZnO-NPs). The broad spectrum band located at 3412 cm-1 indicated the stretching vibration mode of hydroxyl groups of hydrogen bonds (-OH). In addition, the other possible spectrum band located at 2922 cm-1 is attributed to the asymmetric -CH groups (Alkanes) [32]. Similar results were observed in [37]. Moreover, the broad absorption band located around 1381 cm-1 is attributed to asymmetric C=O (Carbonyl) stretching vibration modes [38]. The band observed around 841cm-1 is ascribed to the C-H out-of-plane bending for Zinc oxide nanoparticles (ZnO-NPs). Furthermore, the band located at around 566 cm-1 is attributed to the vibration of Zinc oxide nanoparticles (ZnO-NPs) [39]. The absence of some peaks on zinc oxide nanoparticles (ZnO-NPs) doped by europium ion (Eu3+) was might be due to the change in parameters and the bond properties of Zn2+ perturbed by Eu3+. This means that the bonding properties of europium ion (Eu3+) are higher than that of the bonding properties of Zn2+ and this eliminates the existence of some peaks. In all, in the doped samples there is change in structures thus doping effect of rare earth elements should play a vital role in the minor shift on the peak position. Eventually, the shift of peak position in the doped samples compared to the un-doped zinc oxide nanoparticles (ZnO-NPs) designates that the vibration mode analysis of zinc oxide nanoparticles was straggled due to the existence of dopant metal on its environment.
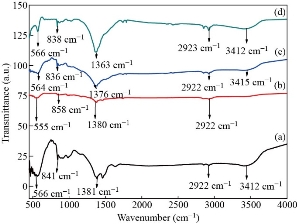
Fig. 8 FT-IR spectra of synthesized of (a) un-doped, (b) Zn0.97Eu0.03O, (c) Zn0.94Eu0.06O, and (d) Zn0.91Eu0.09O NPs.
Fig. 9 shows the UV-Visible absorption spectra of degraded methylene blue (MB) by europium ion (Eu3+) doped and un-doped zinc oxide nanoparticles in the wavelength range of 200–800 nm. The maximum absorption peak of methylene blue (MB) is at λpeak = 665 nm continuously decreasing with the increase of UV light exposure time (0 -60 min). The decrease in the relative intensities of absorption of methylene blue (MB) by europium ion (Eu3+) doped zinc oxide nanoparticles (ZnO-NPs) is faster than that of un-doped zinc oxide nanoparticles (ZnO-NPs) which indicate that the europium ion (Eu3+) doping improves the performance degradation of dye under UV light illumination [38]. Un-doped zinc oxide nanoparticles (ZnO-NPs) exhibit 76.8% photo-degradation of methylene blue (MB) solution which is lower than europium ion (Eu3+) doped zinc oxide nanoparticles samples. The photo-degradation efficiency of europium ion (Eu3+) doped zinc oxide nanoparticles (Zn0.97Eu0.03O, Zn0.94Eu0.06O, and Zn0.91Eu0.09O NPs) were found to be 78.15%, 88.63%, and 97.2%, respectively. Among the europium ion (Eu3+) doped zinc oxide nanoparticles (Zn0.91Eu0.09O ) have the highest photocatalytic activity than those of the un-doped zinc oxide nanoparticles (ZnO-NPs). Fig. 10b shows the absorption spectra of europium ion (Eu3+) doped and un-doped zinc oxide nanoparticles (ZnO-NPs) recorded at different irradiation times. Photocatalytic activity for degradation of methylene blue (MB) obeys the pseudo-first-order reaction kinetics with ![]() as the rate constant (photocatalytic degradation constant) and t is the UV irradiation time given by Eq. 15 [40],
as the rate constant (photocatalytic degradation constant) and t is the UV irradiation time given by Eq. 15 [40],
![]() (15)
(15)
where, ![]() is the initial concentrations of methylene blue (MB) in the solution at t = 0 and
is the initial concentrations of methylene blue (MB) in the solution at t = 0 and ![]() is the concentration methylene blue (MB) at the time of t, respectively. The first-order kinetics of methylene blue (MB) degradation has been carried out and the result is depicted in Fig. 10c. It shows the variation of (
is the concentration methylene blue (MB) at the time of t, respectively. The first-order kinetics of methylene blue (MB) degradation has been carried out and the result is depicted in Fig. 10c. It shows the variation of (![]() ) as a function of UV exposure time for different europium ion (Eu3+) concentration photocatalysts. From this figure, it has been observed that all the four degradation graphs of methylene blue (MB) follow the first pseudo order kinetics model. After discoloration of the dye, it has been monitored to time and the reaction constant and the half-life time of the processes can be calculated under study. In our study, it is observed that europium ion (Eu3+) doped zinc oxide nanoparticles (ZnO-NPs) give better results than un-doped zinc oxide nanoparticles (ZnO-NPs). In europium ion (Eu3+) doped zinc oxide nanoparticles (ZnO-NPs), the europium ions (Eu3+) create defect states which absorb the recombination pair by leaving the hydroxyl and amplifying the photocatalytic efficiency. The synthesis method and ordering nature of the catalyst have also a high impact on this efficiency. A higher degree of crystallinity observed from the XRD result in europium ion (Eu3+) doped samples may be one of the reasons responsible for this phenomenon. Generation of much superoxide and hydroxyl ions takes place with an increase in UV irradiation time for the higher amount of catalysts which provide a higher number of active sites on the surface. This makes the chemical decomposition of more dye molecules containing complex organic structures. As discussed above, among rare earth elements, europium ions (Eu3+) are also involved in a charge transfer process with the host zinc oxide nanoparticles (ZnO-NPs) avoiding easy recombination of photoinduced electron-hole pairs. The 4f-levels of these ions are the prime responsible factors for this photocatalytic process. From our study, it is predicted that the increased photocatalytic efficiency of europium ion (Eu3+) doped zinc oxide nanoparticles (ZnO-NPs) can be greatly associated with the high surface adsorption ability and electron acceptor concentration of REE ions. Defect states like oxygen vacancy (
) as a function of UV exposure time for different europium ion (Eu3+) concentration photocatalysts. From this figure, it has been observed that all the four degradation graphs of methylene blue (MB) follow the first pseudo order kinetics model. After discoloration of the dye, it has been monitored to time and the reaction constant and the half-life time of the processes can be calculated under study. In our study, it is observed that europium ion (Eu3+) doped zinc oxide nanoparticles (ZnO-NPs) give better results than un-doped zinc oxide nanoparticles (ZnO-NPs). In europium ion (Eu3+) doped zinc oxide nanoparticles (ZnO-NPs), the europium ions (Eu3+) create defect states which absorb the recombination pair by leaving the hydroxyl and amplifying the photocatalytic efficiency. The synthesis method and ordering nature of the catalyst have also a high impact on this efficiency. A higher degree of crystallinity observed from the XRD result in europium ion (Eu3+) doped samples may be one of the reasons responsible for this phenomenon. Generation of much superoxide and hydroxyl ions takes place with an increase in UV irradiation time for the higher amount of catalysts which provide a higher number of active sites on the surface. This makes the chemical decomposition of more dye molecules containing complex organic structures. As discussed above, among rare earth elements, europium ions (Eu3+) are also involved in a charge transfer process with the host zinc oxide nanoparticles (ZnO-NPs) avoiding easy recombination of photoinduced electron-hole pairs. The 4f-levels of these ions are the prime responsible factors for this photocatalytic process. From our study, it is predicted that the increased photocatalytic efficiency of europium ion (Eu3+) doped zinc oxide nanoparticles (ZnO-NPs) can be greatly associated with the high surface adsorption ability and electron acceptor concentration of REE ions. Defect states like oxygen vacancy (![]() ) unintentionally incorporated during the synthesis process can also act as an electron scavenger to trap electrons and does not allow recombination of charge carriers and thus increased photo-catalytic performance.
) unintentionally incorporated during the synthesis process can also act as an electron scavenger to trap electrons and does not allow recombination of charge carriers and thus increased photo-catalytic performance.
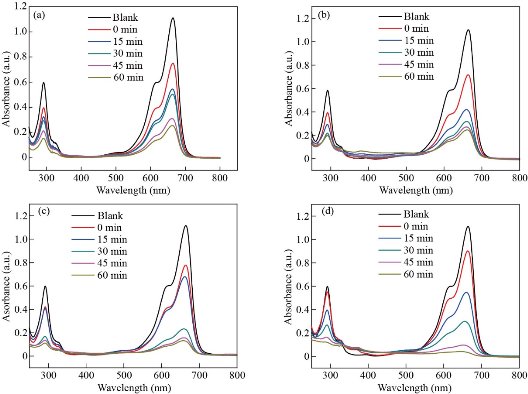
Fig. 9 The absorption spectra for MB solutions containing (a) un-doped, (b) Zn0.97Eu0.03O, (c) Zn0.94Eu0.06O, and (d) Zn0.91Eu0.09O NPs under UV light irradiation for different time intervals with the range of 15 min for an hour.
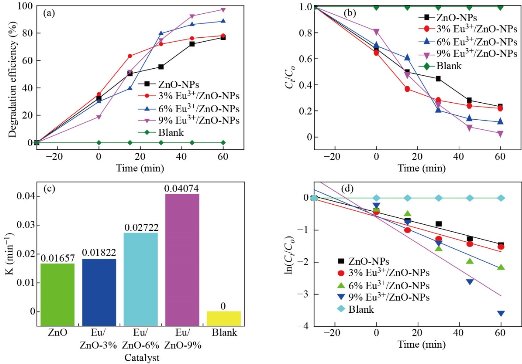
Fig. 10 (a) Efficiency of photo-degradation, (b) photocatalytic degradation activity analysis, (c) the value of photo-degradation rate constant , and (d) photocatalytic degradation kinetic curve study of un-doped, Zn0.97Eu0.03O, Zn0.94Eu0.06O, and Zn0.91Eu0.09O NPs
Conclusions
The europium ion (Eu3+) doped and un-doped zinc oxide nanoparticles (ZnO-NPs) were synthesized via the co-precipitation method by using the zinc nitrate hexahydrate as the starting materials, europium nitrate pentahydrate as the dopant agent, and sodium hydroxide as the precipitating agent. The synthesized samples for europium doped and un-doped zinc oxide nanoparticles (ZnO-NPs) were characterized by spectroscopic techniques such as X-ray Diffractometer (XRD), UV-Vis Spectroscopy, Photoluminescence (PL) Spectroscopy, and Fourier Transform Infra-Red (FT-IR) Spectroscopy. The XRD results revealed that the europium ion (Eu3+) doped and un-doped zinc oxide nanoparticles (ZnO-NPs) were hexagonal wurtzite crystal structures. No other peaks are observed and thus are due to the successful incorporation of europium ion (Eu3+) into the host matrix. From photoluminescence spectral analysis, europium ion (Eu3+) doped and un-doped zinc oxide nanoparticles (ZnO-NPs) exhibited both near band edge emission and visible emission, respectively. The photocatalytic activity of europium ion (Eu3+) doped and un-doped zinc oxide nanoparticles (ZnO-NPs) was investigated by methylene blue (MB) as organic pollutant dye solution and the result revealed that the degradation performance of europium ion (Eu3+) doped zinc oxide nanoparticles (ZnO-NPs) was higher than that of un-doped zinc oxide nanoparticles (ZnO-NPs). In all, europium ion (Eu3+) doped zinc oxide nanoparticles (ZnO-NPs) have great potentiality for the degradation of organic pollutants.
Acknowledgements
This work is financially supported by Adama Science and Technology University and the Ministry of Innovation and Technology of Ethiopia. We would like to appreciate the School of Materials Science and Engineering of Adama Science and Technology University for allowing us to use XRD and to perform photocatalytic activity facilities. And also, we like to appreciate the Biology Department of Adama Science and Technology University for allowing us to perform UV-Vis Spectroscopy and Antibacterial Activity facilities. Finally, the author (s) would like to thank Addis Ababa University in cooperation with the Faculty of College of Natural Science, Addis Ababa, Ethiopia for allowing us to use the FT-IR instruments.
Conflict of Interests
The authors declare that no competing interest exists.
References
[1]A. H. Shah, E. Manikandan, M. B. Ahamed, D. A. Mir, and S. A. Mir, “Antibacterial and Blueshift investigations in sol-gel synthesized CrxZn1−xO Nanostructures," Journal of Luminescence., vol. 145, pp. 944-950, 2014.
[2]R. Guan, J. Li, J. Zhang, Z. Zhao, D. Wang, and H. Zhai, “Photocatalytic Performance and Mechanistic Research of ZnO / g ‑ C 3 N 4 on Degradation of Methyl Orange,” ACS omega, vol. 4, pp. 24, 20742-20747, 2019.
[3]A. Phuruangrat, O. Yayapao, T. Thongtem, and S. Thongtem, “Synthesis and Characterization of Europium-Doped Zinc Oxide Photocatalyst,” Journal of Nanomaterials., 2014.
[4]E. Manikandan, M. K Moodley, S. S. Ray, B. K. Panigrahi, R. Krishnan, N. Padhy, ... & A. Tyagi, “Zinc Oxide Epitaxial Thin Film Deposited Over Carbon on Various Substrate by Pulsed Laser Deposition Technique,” Journal of nanoscience and nanotechnology, vol.10, no. 9, pp. 5602-5611, 2010.
[5]K. S. Khashan, B. A. Badr, G. M. Sulaiman, M. S. Jabir, and S. A. Hussain, “Antibacterial activity of Zinc Oxide nanostructured materials synthesis by laser ablation method,” J. Phys. Conf. Ser., vol. 1795, no. 1, 2021.
[6]M. Karakız, M. Altunbas, E. Bacaksiz, M. Parlak, M. Tomakin, and A. Ozc, “The effects of zinc nitrate, zinc acetate and zinc chloride precursors on the investigation of structural and optical properties of ZnO thin films,” vol. 466, pp. 447–450, 2008.
[7]M. Kaur, P. Kaur, G. Kaur, K. Dev, P. Negi, and R. Sharma, “Structural, morphological and optical properties of Eu-N co-doped zinc oxide nanoparticles synthesized using co-precipitation technique,” Vacuum, vol. 155, pp. 689–695, 2018.
[8]S. Preethi, A. Anitha, and M. Arulmozhi, “A Comparative Analysis of the Properties of Zinc Oxide ( ZnO ) Nanoparticles Synthesized by Hydrothermal and Sol-Gel Methods,” vol. 9, pp. 1–6, 2016.
[9]P. Dumrongrojthanath and A. Phuruangrat, “Photocatalysis of Cd-doped ZnO synthesized with precipitation method,” Rare Met., vol. 40, no. 3, pp. 537–546, 2021.
[10]C. S. N. A. R. Karthick, “Investigation on structural, morphology and photoluminescence properties of lanthanum doped zinc oxide nanostructure for optical application by co-precipitation method,” J. Mater. Sci. Mater. Electron., vol. 29, no. 13, pp. 11553–11558, 2018.
[11]R. K. Sharma and R. Ghose, “Synthesis of zinc oxide nanoparticles by homogeneous precipitation method and its application in antifungal activity against Candida albicans,” Ceram. Int., vol. 41, no. 1, pp. 967–975, 2015.
[12]G. Vijayaprasath , R. Murugan, S. Palanisamy, N. M. Prabhu, T. Mahalingam, Y. Hayakawa, and G. Ravi. “Structural, optical and antibacterial activity studies of neodymium-doped ZnO nanoparticles,” J. Mater. Sci. Mater. Electron., vol. 26, no. 10, pp. 7564–7576, 2015.
[13]M. Maaza, B. D. Ngom, M. Achouri, and K. Manikandan, “Functional nanostructured oxides,” Vaccum, pp. 1–16, 2015.
[14]E. Manikandan, G. Kavitha, and J. Kennedy, “Epitaxial zinc oxide, graphene oxide composite thin- films by laser technique for micro-Raman and enhanced field emission study,” Ceram. Int., vol. 40, no.10, pp. 16065–16070, 2014.
[15]T. M. Rashid, U. M. Nayef, M. S. Jabir, and F. A. Mutlak, “Optik Synthesis and characterization of Au : ZnO ( core : shell ) nanoparticles via laser ablation,” Optik (Stuttg)., vol. 244, p. 167569, 2021.
[16]T.M. Rashid, M.S. Jabi, and U.M. Nayef, “Preparation and characterization of colloidal Au- ZnO Nanocomposite via laser ablation in deionized water and study their antioxidant activity Preparation and characterization of colloidal Au-ZnO Nanocomposite via laser ablation in deionized water and study their antioxidant activity,” J. Phys. Conf. Ser., vol. 1795, no. 1, p. 012057. IOP Publishing, 2021.
[17]E. Manikandan, J. Kennedy, G. Kavitha, K. Kaviyarasu, M. Maaza, B. K. Panigrahi, & U. K. Mudali,.., “Hybrid nanostructured thin-films by PLD for enhanced field emission performance for radiation micro-nano dosimetry applications," Journal of Alloys and Compounds., vol. 647, pp. 141-145, 2015.
[18]O. M. Ntwaeaborwa, S. J. Mofokeng, V. Kumar, and R. E. Kroon, “Structural, optical and photoluminescence properties of Eu3+ doped ZnO nanoparticles,” Spectrochim. Acta - Part A Mol. Biomol. Spectrosc., vol. 182, pp. 42–49, 2017.
[19]N. Azri, K. Aznan, and M. R. Johan, “Quantum Size Effect in ZnO Nanoparticles via Mechanical Milling,” Journal of Nanomaterials., vol. pp. 1–5, 2012.
[20]M. Xin, “Effect of Eu doping on the structure, morphology and luminescence properties of ZnO submicron rod for white LED applications,” J. Theor. Appl. Phys., vol. 12, no. 3, pp. 177–182, 2018.
[21]X. Ma and Z. Wang, “Materials Science in Semiconductor Processing The optical properties of rare earth Gd doped ZnO nanocrystals,” Mater. Sci. Semicond. Process., vol. 15, no. 3, pp. 227–231, 2012.
[22]I. Choudhary, “Effect of excitation wavelength and europium doping on the optical properties of nanoscale zinc oxide,” J. Mater. Sci. Mater. Electron., vol. 31, no. 22, pp. 20033–20042, 2020.
[23]K. Badreddine, I. Kazah, M. Rekaby, and R. Awad, “Structural, Morphological, Optical, and Room Temperature Magnetic Characterization on Pure and Sm-Doped ZnO Nanoparticles,” Journal of Nanomaterials, 2018.
[24]C. Karthikeyan, L. Arun, A. H. Hameed, K. Gopinath, L. Umaralikahan, G . Vijayaprasath, & P. Malathi, “Structural, optical, thermal and magnetic properties of nickel calcium and nickel-iron co-doped ZnO nanoparticles,” J. Mater. Sci. Mater. Electron., vol. 30, no. 9, pp. 8097–8104, 2019.
[25]P. G. Devi and A. S. Velu, “Synthesis, structural and optical properties of pure ZnO and Co-doped ZnO nanoparticles prepared by the co-precipitation method,” J. Theor. Appl. Phys., vol. 10, no. 3, pp. 233–240, 2016.
[26]M. Kasahun, A. Yadate, A. Belay, Z. Belay, & M. Ramalingam, “Antimicrobial activity of chemical, thermal and green route-derived zinc oxide nanoparticles: a comparative analysis,” vol. 12, no. 1, pp. 47–56, 2020.
[27]G. Vijayaprasath, R. Murugan, S. Asaithambi, G. A. Babu, P. Sakthivel, T. Mahalingam,... & G.Ravi, “Structural characterization and magnetic properties of Co co-doped Ni/ZnO nanoparticles,” Appl. Phys. A Mater. Sci. Process., vol. 122, no. 2, pp. 1–11, 2016.
[28]K. P. Raj, K. Sadaiyandi, A. Kennedy, and R. Thamizselvi, “Structural, optical, photoluminescence and photocatalytic assessment of Sr-doped ZnO nanoparticles,” Mater. Chem. Phys., vol. 183, pp. 24–36, 2016.
[29]P. Kumar, B. K. Singh, B. N. Pal, and P. C. Pandey, “Correlation between structural, optical and magnetic properties of Mn-doped ZnO,” Appl. Phys. A, vol. 122, no. 8, pp. 1–12, 2016.
[30]N. A. Salahuddin, M. El-kemary, and E. M. Ibrahim, “Synthesis and Characterization of ZnO Nanoparticles via Precipitation Method : Effect of Annealing Temperature on Particle Size,” vol. 5, no. 4, pp. 82–88, 2015.
[31]K. P. Raj, K. S. A. Kennedy, and S. Sagadevan, “Photocatalytic and antibacterial studies of indium-doped ZnO nanoparticles synthesized by co-precipitation technique,” J. Mater. Sci. Mater. Electron., vol. 28, no. 24, pp. 19025–19037, 2017.
[32]E. I. Naik, H. S. B. Naik, R. V. I. K. Suresh, and G. M. C. Prabhakara, “Bright red luminescence emission of macroporous honeycomb-like Eu3+ ion-doped ZnO nanoparticles developed by gel ‑ combustion technique,” SN Appl. Sci., vol. 2, no. 5, pp. 1–13, 2020.
[33]M. A. Jihad, F. T. M. Noori, M. S. Jabir, S. Albukhaty, F. A. Almalki, and A. A. Alyamani, “Polyethylene Glycol Functionalized Graphene Oxide Nanoparticles Loaded with Nigella sativa Extract : A Smart Antibacterial Therapeutic Drug Delivery System,” J. Molecules., vol.26, no.11, pp.3067, 2021.
[34]P. P. Pal and J. Manam, “Structural and photoluminescence studies of Eu3+ doped zinc oxide nanorods prepared by precipitation method,” J. Rare Earths, vol. 31, no. 1, pp. 37–43, 2013.
[35]L. F. Koao, B. F. Dejene, H. C. Swart, S. V Motloung, and T. E. Motaung, “Characterization of annealed Eu3+-doped ZnO flower-like morphology synthesized by a chemical bath deposition method,” Opt. Mater. (Amst)., vol. 60, pp. 294–304, 2016.
[36]M. Novotny, M. Novotný, P. Fitl, J. More-Chevalier, J. Remsa, V. Kiisk , ... & J. Lančok, “Effect of pulsed laser annealing on optical and structural properties of ZnO : Eu thin film,” Journal of Materials Science., vol. 56, no. 19 pp. 11414–11425, 2021.
[37]M. S. Jabir, U. M. Nayef, W. K. Abdulkadhim, Z. J. Taqi, G. M. Sulaiman, U. I. Sahib,., ... & C. C. Su, “Fe 3 O 4 Nanoparticles Capped with PEG Induce Apoptosis in Breast Cancer AMJ13 Cells Via Mitochondrial Damage and Reduction of NF ‑ κB Translocation,” J. Inorg. Organomet. Polym. Mater., vol. 31, no. 3, pp. 1241–1259, 2021.
[38]T. Ghrib, I. Massoudi, A. L. Al-Otaibi, A. Al-Malki, A. Kharma, E. Al-Hashem, ... & R. A. Al-Zuraie, “Effects of Terbium Doping on Structural, Optical and Photocatalytic Properties of ZnO Nanopowder Prepared by Solid-State Reaction,” J. Inorg. Organomet. Polym. Mater., vol. 31, no. 1, pp. 239–250, 2021.
[39]G. Vijayaprasath, P. Soundarrajan, and G. Ravi, “The point defects induced ferromagnetism in ZnO semiconductor by terbium doping via co-precipitation method,” J. Mater. Sci. Mater. Electron., vol. 29, no. 14, pp. 11892–11900, 2018.
[40]R. B. S. S. S. Srinivasan, “Synthesis, characterization and comparative studies of dual doped ZnO nanoparticles for photocatalytic applications,” J. Mater. Sci. Mater. Electron., vol. 30, no. 1, pp. 582–592, 2019.
Copyright© Gemechu Barsisa, Abebe Belay, Gashaw Beyene, Cherente Seboka, and Kusse Gudishe. This is an open-access article distributed under the terms of the Creative Commons Attribution License, which permits unrestricted use, distribution, and reproduction in any medium, provided the original author and source are credited.

|
Nano Biomedicine and Engineering. Copyright © Shanghai Jiao Tong University Press |
 |