Research Article
Sensitivity of Nanostructured Mn-Doped Cobalt Oxide Films for Gas Sensor Application
Ehssan Salah Hassan 1, Kameran Yasseen Qader 2, Esraa Hassn Hadi 2, Sami Salman Chiad 2, Nadir Fadhil Habubi 2*, Khalid Haneen Abass 3*
1 Department of Physics, College of Science, Mustansiriyah University, Baghdad, Iraq.
2 Department of Physics, College of Education, Mustansiriyah University, Baghdad, Iraq.
3 Department of Physics, College of Education for Pure Sciences, University of Babylon, Iraq.
* Corresponding authors. E-mail: nadirfadhil@uomustansiriyah.edu.iq; pure.khalid.haneen@uobabylon.edu.iq
Received: Mar. 19, 2020; Accepted: Jun. 20, 2020; Published: Jul. 13, 2020
Citation: Ehssan Salah Hassan, Kameran Yasseen Qader, Esraa Hassn Hadi, Sami Salman Chiad, Nadir Fadhil Habubi, and Khalid Haneen Abass, Sensitivity of Nanostructured Mn-Doped Cobalt Oxide Films for Gas Sensor Application. Nano Biomed. Eng., 2020, 12(3): 205-213.
DOI: 10.5101/nbe.v12i3.p205-213.
Abstract
The effect of manganese doped cobalt oxide (Co3O4:Mn) was investigated by two different ratios (1% and 3%), which were precipitated by spray pyrolysis technique (SPT), and was adopted using a laboratory designed glass atomizer. Glass substrates were used to deposit films on them, heated at a temperature of 420 ℃. The structural properties were studied through X-ray diffraction. The results showed that all deposit nanostructured films were polycrystalline and there was a decrease in the preferred reflection intensity along (311) plane resulting in a decrease in the crystallite size. Surface properties were analyzed through atomic force microscopy (AFM), which showed a decrease in the roughness and the particle size growth was a vertical columnar rod. The optical characterization displayed that the transmittance of pure Co3O4 nanostructured films was 48% and decreased to 35% for 1% of the Mn concentration, and continued to decrease to 33% with the increase of manganese concentration up to 3%. Optical energy bandgap of pure Co3O4 nanostructured films was 1.435 eV and decreased to 1.419 eV for 1% of Mn concentration, and continued to decrease to 1.367 eV with the increase of Mn concentration up to 3%. The highest percentage sensitivity was for the sample doped with 3% Mn, which was about 65%, for NO2 gas concentration of 600 ppm, at an operating temperature of 200 ℃.
Keywords: Manganese, Cobalt oxide; SPT; Crystalite size; Columnar rod; Gas sensor
Introduction
Among the different transition metal oxides (TMO), Co3O4 is an imperative p-type semiconductor (coordinate energy bandgap at 1.48 and 2.19 eV) [1, 2]. Generally utilized as an electrochemical gadget [3], heterogeneous impetus [4], gas sensor [5], anode material in lithium batteries [6], and sunlight based vitality safeguard [7]. Recently the consideration regarding transition metal oxides has been taken into account. Metal oxide nanostructures play an essential role in numerous locales of science, physical science, ecological science, and material science [8-10]. These TMO, while falling in the nano estimated administration, are relied upon to have significantly witnessed an increasing interest in the fields; for example, information stockpiling, spintronics biomedicine, and broadcast communications [11-14]. These features are firmly subject to their dimension and surface properties. The Co3O4 shows an ordinary spinal structure, in which Co2+ is engaged in tetrahedral destinations and Co3+ is engaged in octahedral locales [15]. This is very attractive because of the twists of Co2+ particles, with a little commitment from turn circle coupling. Then again, Co3+ particles have no perpetual attractive point as a result of the part of 3D levels of the octahedral precious stone field and finish filling of levels [16]. Given the attractive properties of permeable Co3O4 small scale 3D squares, the antiferromagnetic Co3O4 displays a specific level of ferromagnetism under outside attractive field because of the unpaired particles’ closeness to the surface of the nanocrystals and the association of molecules. The unique properties of nanoparticle unequivocally reliant change of shapes and sizes and crystallization, charge heading [17]. Recently, a few procedures have been utilized to enhance the conduct of metal oxides by methods for presenting different dopants [18], shaping nanocomposites with p-n intersection [19], and by tuning the morphology [7], have focused on the electrical and surface properties of nanoparticles to accomplish enhanced reactant, electro-optical, attractive, substance, and physical properties [20]. Co3O4:Mn produced by sol-gel spin coat method has polycrystalline nature with degradation in the crystallization with increased manganese concentration, and the output phase is cubic with the appearance of orthorhombic MnO2 phase. Shan, and Dai [21] explained that the doping of cobalt by magnesium causes a decrease in particle size and most particles had a nano-spherical shape and the size were between 82 - 244 nm. In this research Mn doped cobalt oxide is prepared to study their physical properties to use these films as a gas sensor [22-24]. The PLAL synthesized MoS2 NS explained the vast absorbance in Vis region. Photocatalytic activity of TiO+–ZSM5–MoS2 nanocomposite was examined with arsenite. TiO2–ZSM5–MoS2 nanocomposite displayed nearly 100% arsenic photo-conversion to Usenet. This work aims to consider the effect of deformation on the sensitivity of the deposited films for NO2 gas.
Experimental
An aqueous solution of 0.1 M of CoCl2.6H2O supplied from Merck Chemicals (Germany) was used to prepare thin films of Co3O4 [25], and 0.1 M of Manganese chloride MnCl2.4H2O was used as doping agent with a concentration of 1% and 3% to obtain Mn doped cobalt chloride [26]. A few drops of HCl were added to obtain a homogeneous solution. The spray pyrolysis technique was adopted with an experimental intended glass spray [27]. Glass substrate was used for deposition heated at a temperature of 420 °C. The following optimal status was taken into account, with spray time of 8 s. The spray was sprayed with two limits of 1.5 min to avoid excessive cooling and to prevent cracks. Nitrogen carrier gas was upheld at a pressure of 105 Nm-2. The space between the nozzle and the substrate was 28 ±1 cm, at solution flow rate of 4 mL/min. Film thickness was dignified using gravimetric process and was found to be about 320 nm. Optical transmittance and absorbance employing UV-visible spectrophotometer were verified in the wavelengths range of 300 - 1100 nm (Shimadzu Company, Japan). High accuracy XRD was utilized to investigate the structural qualifications of thin films employing D8 Advance Bruker system, CuKα (λ = 0.154056 Å).
Results and Discussion
XRD spectra of pure and Mn : Co3O4 nanoparticles are illustrated in Fig. 1(a), (b) and (c), from which the phase and crystalline structure were diagnosed. The samples were polycrystalline with a clear difference in intensity of reflections from crystalline levels for all diffraction peaks. The preferred reflection was (311) plane at 2θ = 36.92º, with several secondary reflections of (220), (222), (400), (511) and (440) at 2θ = 31.27º, 38.32º, 44º, 60.12º and 56.19º respectively. These results assured predominant of the cubic phase with no reflections for any phases concerning manganese. These peaks were in a perfect match with JCPDS data (JCPDS Card No. 43-1003) [28]. Note that the effect doping concentrations increasing up to 3% did not change the phase of cobalt oxide, and these were the most important conditions of doping, as well as through the alteration in intensity of scattering for the peaks produced. The doping of ions with a smaller ionic radius Mn2+ (0.80 Å) than the host material Co2+ (0.72 Å) led to a change in the values of lattice constant which could be followed by a deviation in the angle of reflection of the preferred plane towards the smaller angle. A noticeable decrease in the intensity of the preferred reflection (311) plane as shown in Fig. 1(d), (e) and (f) indicated an increase in the lattice constant. Fig. 2 offers the crystallite size of the prepared films considered from the FWHM witch represented the full width of high maximum; (β) for higher intensity (311) plane by applying Scherrer’s Equation (1) [29] showed a decrease in crystallite size (D) via an increase in doping ratio due to interstitial doping processes. The results are shown in Table 1.
![]()
where λ is x-ray wavelength, θ is Bragg’s angle and K is the shape factor. The Microstrain was calculated from Equation (2) [30, 31], resulting from the growth of the film, which in turn produced pressure and expansion in the lattice. Varying the displacement of the atom based on their original location increased the microstrain ε. Fig. 2 shows the increase in doping ratio leading to an increase in microstrain, which was caused by the decrease in crystallinity of the film.
![]()
Equation (3) was used to calculate the dislocation density δ; Fig. 2 displays the dislocation density increasing as Mn concentration increased, which agreed with the results obtained in previous studies [32, 33].

The results of ε and δ values are listed in Table 1. Topography of pure and Mn-doped Co3O4 films was calculated by AFM (Fig. 3). The roughness, RMS and average grain size were also collected from 2D images. In Fig. 3, a clear variation in morphology of Mn-doped Co3O4 films as Mn dopant concentration was increased. The AFM images of the pure Co3O4 showed that the particle size was regular in shape with a maximum RMS roughness of 0.431 nm . RMS roughness acts as the standard deviation, which is important to describe surface roughness by statistical methods. As the Mn dopant increased from 1% to 3 % (Fig. 3(b) and (c)), the columnar growth enclosed grains with a rod profile could be affected by the merger of Mn on the developing surface. The spreading of the crystallites on surface morphology was uniform with decreases in the RMS from 1.36 nm to 1.23 nm as the Mn concentration increased from 1% to 3%. Apart from that, the average diameter decreased from 86 nm to 76 nm due to decomposition in the lattice. The optical transmittance of undoped and Mn doped Co3O4 films was measured by UV-Vis spectrophotometer. The first beam passed through the undoubted substrate while the second beam passed through the thin film. The transmittance depended strongly on Mn concentration as shown in Fig. 4. The transmittance of the undoped Co3O4 film approached 48% in the near-IR spectrum. Fig. 4 demonstrated lower transmittance of 38% to 33% with the increase of doping concentration from 1% to 3%, respectively. The decrease in surface roughness with increasing doping concentration is shown in Fig. 4(a)-(c). Fig. 4(d) represents the absorption values that were observed to increase with increasing doping concentration that could be related to the doped thin films that could absorb light in a broader range of wavelengths and operate extra light energy than Co3O4 thin film. The absorption spectrum took exponential decay with increasing wavelength due to the low energy of the falling photons and their inability to lift electrons from the valence band to the conduction band (Fig. 4(d)). The values of the energy gap depended on the precise structure of the deposition membrane on the arrangement and distribution of atoms in the crystalline bond [34]. Cobalt oxide compounds have a direct and indirect energy gap [35] and may vary depending on the type of deposition or conditions. Fig. 5(a)-(c) shows the graph of (αhν)2 vs E (eV) for direct energy bandgap of pure and Mn-doped Co3O4 thin film. The value obtained for the energy gap of the cobalt oxide of 1.435 eV differed from the standard value of 1.419 eV [36]. This difference in the value of energy gap could be achieved by deposition mechanisms or conditions accompanying this deposition. Fig. 5(a) and (b) shows a decrease in the energy gap values from 1.419 eV to 1.367 eV with the increase of Mn concentration from 1% to 3%, respectively. This might be due to a decrease in crystallite size values calculated from the X-ray diffraction pattern and the atomic force microscope, which led to crystallization weakness [37]. Absorption coefficient (α) can be defined through Equation (4). α decreased with increases of λ increases (Fig. 5(d)-(f) due to an increase in the Mn concentration leading to an increase in Mn2+ ions [38]. α was obtained utilizing the following Equation (4) [39]:
![]() (cm-1), (4)
(cm-1), (4)
where t is the film thickness. The refractive index (n) is shown in Fig. 6, calculated from reflectance (R) via Equation (5) [40]. The study of refractive index obtained a clear picture of the properties and visual behavior of the films recorded for the pure film's refractive index values of 2.6 which were taken down to 2.4 then to 2.3 with an increase in dopant concentration from 1% to 3%, respectively, due to the increased density of the medium, besides the scattering of the incident light at the grain boundaries [41].

Fig. 7 represents the dynamic resistance change as a function of time for several NO2 gas concentrations (200, 400, 600, and 800 ppm) at operating temperature of 200 oC for Co3O4 and Mn doped Co3O4. It was noted that the resistance values were limited to 5 - 45 kΩ.m; the greatest resistance was recorded in the presence of air Ra for the undoped samples; the resistance values decreased with the doping ratio due to increasing number of charge carriers. The resistance of the sample decreased with increasing gas concentration from 200 to 800 ppm, which can be due to surface roughness. All recorded samples had a negative connection feature, a decrease in resistance with an increase in concentration of NO2 gas. When O2 molecules are adsorbed on the surface of metal oxides (Fig. 7(b)), which leads to the capture of electrons from the conduction band (Ec), the electrons are held on the surface of the films as models (O−, O−2, O2−). This will raise an electron-depleted region. The electron-depleted region is called the space-charge layer, of which thickness is the length of the band bending region. The interaction of these components with oxidizing gas or competitive adsorption and replacement of the adsorbed oxygen by other molecules decreases, and can reverse the band bending, resulting in a decrease in depletion region of the Co3O4 : Mn gas sensor as reacting with NO2 gas and extend in the depletion layer as Co3O4:Mn reacting with reduced gas Fig. 7(c). Fig. 8 represents the sensitivity percentage values calculated from Equation (6) [42]. Fig. 7 depicts Co3O4 : Mn films that deposited on the glass by the SPT method at an operating temperature of 200 oC as a function of NO2 gas concentrations. It could be seen that the highest percentage sensitivity was sample doped with Mn of 3%, which was about 65%, possibly due to the increase in the number of charge carriers of holes owing to the doping and the increase in crystallite size, reducing the depletion layer and potential barrier.
where Ra is resistance of the film sensor in the presence of air, and Rg resistance of the film in NO2 gas. Fig. 9(a) represents the response time as a function of gas concentration of NO2. It was observed the minimum response time was in the 3% doping concentration, and at the concentration of the gas 800 ppm, it was about 4 s. (Reducing time is a good feature of sensors.) In general, the response time decreased with the increase of gas concentration, which could be due to the increased charge carrier concentration by adsorption and absorption of the gas to the surface. Fig. 9(b) represents the recovery time or return time as a function of NO2 gas concentrations, where the minimum recovery time of the 1% model was equal to 10 s (Reducing time is a good feature of sensors). This occurred due to the deforming of films at 150 oC. Continuous exposure to operating temperature caused the film properties to change with the change of gas sensing properties [43].
Table 1 Structural factors of Co3O4 : Mn thin films prepared SPT
|
Sample |
Plane (hkl) |
2θ (°) |
Lattice constant A (Å) |
Β (Rad) |
D (nm) |
ε (line-2.m-1.10-3) |
δ (line.m-2.1015) |
|
Pure |
(311) |
36.92 |
8.98 |
0.492 |
15.62 |
1.98 |
4.10 |
|
1% |
(311) |
37.02 |
8.121 |
0.547 |
14.32 |
2.25 |
4.88 |
|
3% |
(311) |
37.12 |
8.123 |
0.711 |
11.20 |
2.97 |
7.97 |
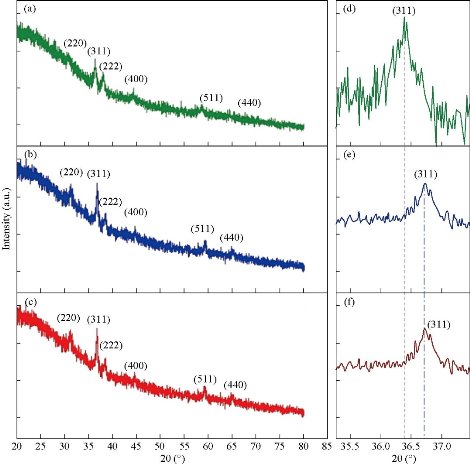
Fig. 1 XRD patterns of (a) pure Co3O4, (b) 1% and (c) 3% Mn doped Co3O4, (d)-(f) drift in 2θ of the preferred plane of pure, 1% and 3% Mn doped Co3O4, respectively.
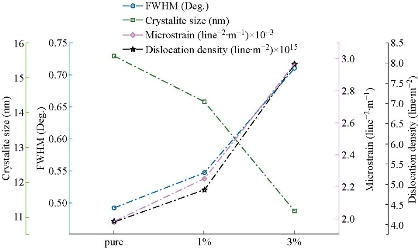
Fig. 2 β, D, ε and δ of pure, 1% and 3% Mn doped Co3O4.
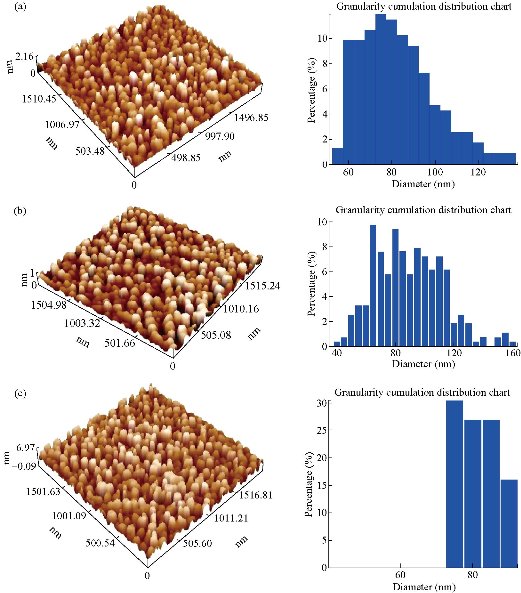
Fig. 3 AFM image of (a) pure Co3O4, (b) 1% and (c) 3% Mn doped Co3O4.
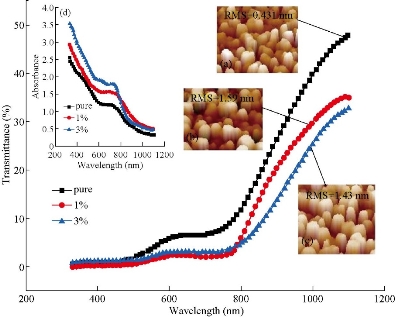
Fig. 4 Optical spectrum transmittance of Co3O4 : Mn: (a)-(c) 3D image for pure, 1% and 3% Mn doped Co3O4, respectively; (d) spectrum absorption of Co3O4 : Mn.
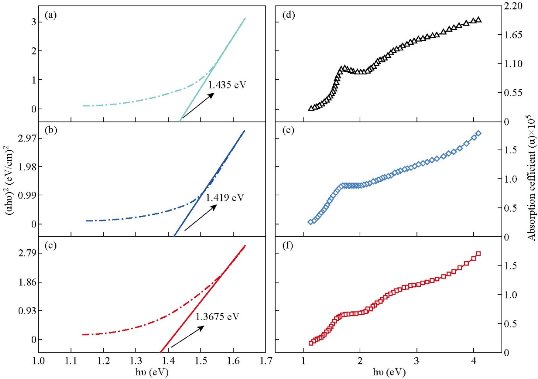
Fig. 5 (a)-(c) The optical energy gap of pure, 1% and 3% Mn doped Co3O4, respectively; (d)-(f) the absorption coefficient of pure, 1% and 3% Mn doped Co3O4, respectively.
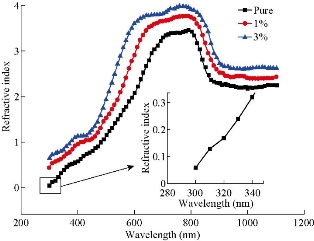
Fig. 6 The refractive index of pure and Mn doped Co3O4, deposited by the spray pyrolysis technique.
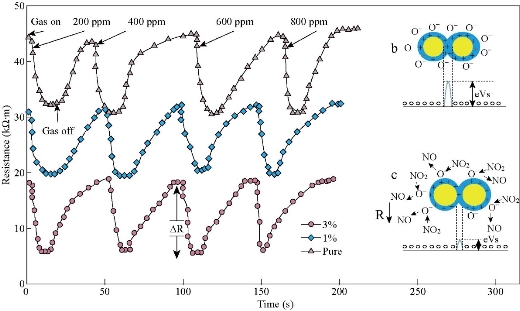
Fig. 7 Resistance change as a function of time of Co3O4 : Mn films for changed concentrations of NO2 gas at a working temperature 150 oC.
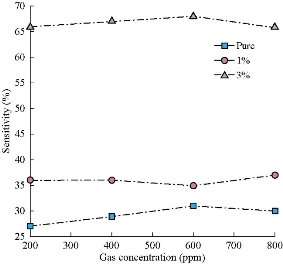
Fig. 8 Percentage sensitivity change of Co3O4 : Mn films for changed concentrations of NO2 gas at a working temperature of 150 oC.
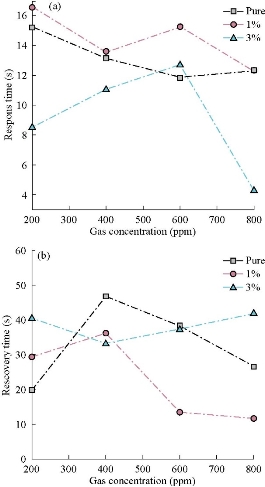
Fig. 9 (a) Response time and (b) recovery time. Change of Co3O4 : Mn films for different concentrations for NO2 gas at a working temperature 150 oC.
Conclusions
Undoped and Mn-doped Co3O4 were produced by the SPT. The structural description of the samples studied by XRD displayed polycrystalline with cubic structure; the crystallite size reduced from 15.62 nm for the pure Co3O4 to 11.2 nm upon 3% Mn-doped Co3O4 samples. The morphology investigation by AFM showed a columnar growth containing grains with a rod shape, which can be caused by a combination of Mn on the developing surface. The incorporation of Mn into Co3O4 weakened the energy band due to the formation of surface-associated defects in the nanoparticles. We concluded that the electrical resistance of the films were reduced from 45 kΩ to 18 kΩ with the increasing of doping rate, and that the best sensitivity to the gas NO2 was 65% by 3% Mn content. With the concentration of gas 800 ppm at a temperature of 150 oC, the best recovery time was 10 s, and the best response time was 4 s to the doped film by 3%, with the concentration of gas 800 ppm at a temperature of 150oC.
Acknowledgments
This study was completed with the help of Mustansiriyah University, College of Science, physics department, and college of Education, physics department.
Conflict of Interests
The authors declare that no competing interest exists.
References
Copyright© Ehssan Salah Hassan, Kameran Yasseen Qader, Esraa Hassn Hadi, Sami Salman Chiad, Nadir Fadhil Habubi, and Khalid Haneen Abass. This is an open-access article distributed under the terms of the Creative Commons Attribution License, which permits unrestricted use, distribution, and reproduction in any medium, provided the original author and source are credited.

|
Nano Biomedicine and Engineering. Copyright © Shanghai Jiao Tong University Press |
 |