Research Article
Bioactivity Behaviour of Osteoblasts on Commercially Pure Titanium with TiO2-ZrO2 Nanocomposite Mixture Coating
Thekra Ismael Hamad 1*, Rawaa Zaher Hassan Zwain 2, Ali Mohammad Ali Aljafery 2
1 Department of Prosthodontics, College of Dentistry, University of Baghdad, Iraq.
2 Department of Prosthodontics, College of Dentistry, University of Kufa, Iraq.
* Corresponding author. E-mail: Thikra_963@yahoo.com Tel.: 009647902299017
Received: Aug. 1, 2019; Accepted: Nov. 20, 2019; Published: Nov. 20, 2019
Citation: Thekra Ismael Hamad, Rawaa Zaher Hassan Zwain, and Ali Mohammad Ali Aljafery, Bioactivity Behaviour of Osteoblasts on Commercially Pure Titanium with TiO2-ZrO2 Nanocomposite Mixture Coating. Nano Biomed. Eng., 2019, 11(4): 361-367.
DOI: 10.5101/nbe.v11i4.p361-367.
Abstract
This study aims to improve the bioactivity response of osteoblasts attachment and proliferation on commercial pure titanium surface by the mixture of nanocomposite coating material of 70% TiO2 (rutile 10-30 nm, Sky Spring Nanomaterials, USA) and 30% ZrO2 (20-30 nm, Sky Spring Nanomaterials, USA). This may increase the likelihood of developing the modified implant surface by electrophoretic deposition and the dipping methods of nanocomposite mixture to enhance the surface bioactivity and promote bone formation. Three groups of commercially pure titanium: one uncoated group and two coated groups with nanocomposite mixture of different coating techniques; one group for electro photic deposition technique (EPD); and one group for dip technique. The bioactivity evaluation of cell cultures, isolation of osteoblast cells from calvaria and long limbs of 3-4 days neonatal rats to evaluate the attachment and the proliferation assay in 4 and 8 days of incubation periods for each group. However, osteoblast cells attachment and proliferation showed the least attached and proliferated cells in uncoated samples, while the EPD coated sample showed the highest.
Keywords: Nanocomposite; Commercially pure titanium; Osteoblasts; Electrophoretic deposition; Dip technique
Introduction
Dental implants made from titanium are regarded as the most preferable treatment plan for restoring the lost teeth. The most important property of the dental implant success is the new bone formation at implant-bone interference (osseointegration) [1]. For medical devices, orthopaedic and dental implants, titanium is a fabric of choice [2, 3]; the surface properties of the dental implants can be affected significantly by different surface modifications [4]. Coating of CpTi discs with a mixture of 70% TiO2 and 30% ZrO2 nanocomposite has been studied with respect to the increasing of surface roughness [5]. Electrophoretic deposition process (EPD) is a colloidal deposition process that can be considered as a colloidal forming method where charged particles inside the suspension are deposited on the opposite charged substrate by the aid of electrical field [6]. Dip coating can produce thin homogenous coating, providing better control of the chemical composition and macrostructure of the coating as well as improving the biological activity of the titanium implants which enhance bone formation [7]. Cell culture is the operation of cell grown under controlled conditions, generally, outside their natural surroundings. Vivo and vitro studies indicate that ZrO2 ceramics exhibit good biological compatibility and good bone response. Thus the addition of ZrO2 to TiO2 ceramics may improve the mechanical properties and bioactivity of TiO2 coating on Ti surface [8].
Experimental
Sample preparation techniques
Commercial pure titanium (grade 2) was cut into small circular discs (10 mm in diameter and 1 mm in thickness). They were polished with a lathe machine and cleaned using the substrate for coating. After polishing and cleaning the samples, they were coated with nanocomposite mixture of 70% TiO2 and 30% ZrO2 by EPD and dip techniques [5].
Cell culture media preparation
Heat-inactivated fatal calf serum of 10% was added; 1% of antibiotics and 0.5% of antifungal to alpha minimum essential minerals (αMEM), containing (L- glutamine, rib nucleosides and 2.2 g/L NaHCO₃) were used [9, 10].
Collagenase II solution preparation
1 mL of distilled water was added to 100 mg of collagen II for dilution after a good shaking by hand, transferring to a 50 mL flask and further dilution in 49 mL of Hank buffered salt solution (HBSS) to obtain 2 mg/mL (0.2% (w/v) [10].
Isolation of rodent calvarial rat osteoblast
According to Taylor and Naji [9, 10], the following steps were done. Firstly, approximately 3-4 day neonatal rat was sacrificed by sedation with absolute chloroform and sterilized in 70% ethanol. Head was with scalpels. Skin, brain, muscles, tendons, and any soft tissues were carefully removed with scalpel and tweezers, leaving the skull and mandible. The tissue was transferred to 15 mL test tube and washed 3 times with phosphate-buffered saline (PBS). The bone tissue of calvaria and long limbs were transferred to two 15 mL test tubes; each tube was washed 3 times with PBS. Then, 0.25% trypsin in PBS (1 mL/calvaria and 1 mL/ long limbs) was added to the pellet and incubated for 10 min at 37 °C, 5% CO₂. Trypsin solution was washed with 5 mL αMEM, spinning at 5500 rpm for 5 min at room temperature to each test tube. The working solution was used once and then discarded. Then, 0.2% collagen type II solution (0.8 mL/calvaria and 1 mL/long limbs) was added to the pellet and incubated for 30 min at 37 °C, 5% CO₂. Collagenase solution was washed with 5 mL αMEM, spinning at 5500 rpm for 5 min at room temperature for each test tube. The solution was discarded. The fresh collagenase solution was added and incubated for 60 min at 37 °C, 5% CO₂. The solution was washed with 5 mL αMEM, spinning at 5500 rpm for 5 min at room temperature. The supernatant was discarded. The cells were suspended in αMEM (1 mL/calvaria and 1 mL/long limbs). 20 mL αMEM was added to 1 mL cell suspension in 75 cm² flasks and incubated at 37 °C, 5% CO₂ for confluence within ~3 days. Precautions regarding contamination-free procedures were followed by using biosafety hood, sterilized surgical tools, disposable micropipette and syringes, careful handling of materials and solutions, and wearing gloves and masks.
Sterilization of the discs
The discs of the three groups were saved in aluminium foil, then put in an oven at 250 °C for 60 min to ensure decontamination. The discs were transferred to biosafety hood after cooling and further sterilization with ultraviolet light [10].
Extraction of cells
The incubation period for each flask was 8 days. Then the extraction of cells was done as follows [11]: The media were removed and washed from the flask by PBS. Then, 2 mL trypsin was added to the flask, waiting for 10 min incubation at 37 °C. The solution was inactivated by adding 10 mL αMEM and transferring to 15 mL test tube, spinning at 5500 rpm g for 5 min at room temperature. The cell palate was kept after discarding the supernatant. After that, 1 mL of media and counted cells were added by using a Neubauer chamber. The discs of the three groups were set in each well of the microtitre plate (5 discs of each group and each incubation period) and 2 × 10³ cells were seeded for each disc. A negative control well was cultured without discs at the bottom of the well was manufactured to receive cell and was ready for cell attachment. 1 mL of αMEM media was added to each well and then covered and incubated at 37 °C, 5% CO₂. Then, every 2-3 days, the half media in the microtitre plate was exchanged with new media.
Attachment assay
The trypsinization method was used in the attachment assay after the limited incubation period which did not exceed 24 h, so as to avoid proliferation and maturation of the cells. Cells in the culture media were counted by using a Neubauer chamber [12]. After transferring the discs to a graduated test tube, the discs were washed three times with PBS and discarded, and then 1 mL of trypsin solution was added, waiting for 10 min. After that, 5 mL of media were added to the solution. The disc was removed. The graduated test tube was spun at 3500 rpm for 5 min, keeping the pellet after discarding the supernatant and resuspended with 1mL of media. The cell was counted by using a Neubauer chamber.
Proliferation assay
In this assay, discs of the three groups were further divided into two periods: 4- and 8-day periods. Each period was tested separately to count the cell actually attached to the discs by the trypsinization method as mentioned in the attachment assay [12].
Fixation of the cells [13]
The disc was removed from the microtitre well and transferred to a petri dish, then washed carefully with PBS and the solution was discarded. After that, 1 mL of 10% formalin was gently added to the disc and fixed for 15 min at room temperature, then gently removed and washed with distilled water.
Preparation of alizarin red working solution
About 0.7 g of alizarin red was dissolved in 25 mL of distilled water, shaken carefully by hand, and then the final volume was brought to 50 mL [10].
Staining of the cells
About 500 μL of alizarin red S (ARS) solution was added to each disc. The solution was incubated for 20 min at room temperature with gentle shaking and gently discarded. Then the discs were washed with 1 mL distilled water 4 times, leaving the discs 5 min at each time, and the water was replaced for each interval.
Results and Discussion
Attachment assay
The optical microscope image was taken for all three groups (control, EPD and dip) as shown in Fig. 1. The control group showed less cellular attachment with the presence of surfaces free of cells, whereas the EPD and dip showed an increase in cell attachment with a decrease in cell-free surfaces. Descriptive statistics of the three groups (control, EPD and dip) regarding the attachment assay are summarized in Table 1 and Fig. 2. The table shows the lowest mean with a control group (607 cells) and the highest mean in the EPD group (814 cells). The equality of means of the three groups was tested by ANOVA as shown in Table 2. It was found that there was a highly significant difference among the experimental groups p < 0.01 at two degrees of freedom. Multiple comparisons revealed that there was a highly significant difference between control and EPD, and between control and dip (p < 0.01), while a non-significant difference between EPD and dip-coated disc (p > 0.05).
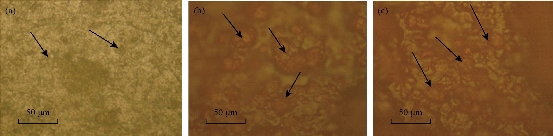
Fig. 1 Attachment of osteoblast cells in (a) control disc, (b) dip-coated disc, and (c) EPD coated disc.
Table 1 Descriptive statistic (ANOVA test) for cell attachment
|
Group |
N |
Mean |
Standard deviation |
F |
P-value significance |
|
Control |
5 |
607.40 |
44.75 |
38.61 |
0.000 |
|
EPD |
5 |
814.80 |
25.26 |
|
|
|
DIP |
5 |
784.80 |
47.32 |
|
|
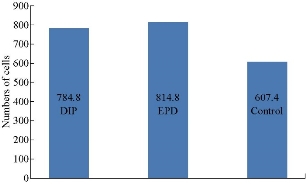
Fig. 2 Chart comparisons of different groups in attachment assay.
Table 2 Multiple comparisons between different groups
|
|
Mean difference (I-J) |
P-value significance |
|
|
Control |
EPD |
-207.40 |
0.000 |
|
DIP |
-177.40 |
0.000 |
|
|
EPD |
DIP |
30.00 |
0.262 |
Proliferation assay (4- and 8-day incubation period)
Optical microscopic images for each group at two periods are shown in Fig. 3 for the control group, in Fig. 4 for the dip group, and in Fig. 5 for the EPD group. A significant difference in proliferation capacity is seen with an increased incubation period. As seen on the 4th day, there were some spaces without cell coverage, while on the 8th day cellular proliferation was seen to correspond to surface treatment. Table 3 and Fig. 6 show the descriptive statistics of proliferation assay on the 4th day for all tested groups (control, EPD and dip). The EPD disc exhibited the highest cellular proliferation (1721) followed by dip-coated (1502) and uncoated disc (1339). ANOVA test was used to test the proliferation assay in 4-day incubation period (Table 4). It was found that there was a highly significant difference among the groups (p < 0.01) at 2 degrees of freedom. Multiple comparisons revealed that there was a highly significant difference between control and EPD, and between EPD and dip (p < 0.01). Also, there was a significant difference between control and dip, and between EPD and dip (p < 0.05). Table 5 and Fig. 7 show the descriptive statistics of proliferation assay in 8 days for all tested groups (control, EPD and dip). The EPD disc exhibited the highest cellular proliferation (2983) followed by dip- coated (2584) and uncoated disc (2438). ANOVA test was used to test the proliferation assay in the 8-day incubation period (Table 6). It was found that there was a highly significant difference among the three groups (p < 0.01) at 2 degrees of freedom. Multiple comparisons revealed that there was a highly significant difference between control and EPD, and between EPD and dip (p < 0.01). Besides, there was a non-significant difference between the uncoated and the dip.
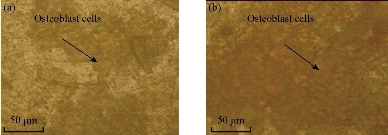
Fig. 3 Cellular proliferation on control disc: (a) After 4 days and (b) after 8 days.
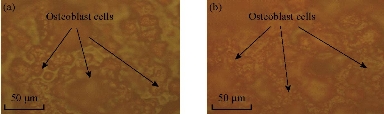
Fig. 4 Cellular proliferation on dip-coated disc: (a) After 4 days and (b) after 8 days.
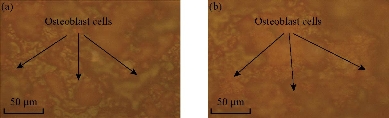
Fig. 5 Cellular proliferation on EPD coated disc: (a) After 4 days and (b) after 8 days.
Table 3 Descriptive statistic (ANOVA test) for cellular proliferation in 4 days
|
|
N |
Mean |
Standard deviation |
F |
P-value significance |
|
Control |
5 |
1339.00 |
84.14 |
14.68 |
0.001 |
|
EPD |
5 |
1721.80 |
88.63 |
|
|
|
DIP |
5 |
1502.80 |
150.82 |
|
|
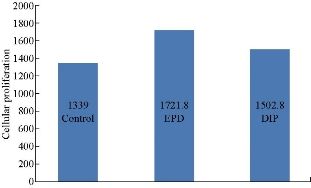
Fig. 6 Chart comparisons of different groups in a 4-day proliferation assay.
Table 4 Multiple comparison (LSD) for proliferation assay on the 4th day
|
|
Mean difference (I-J) |
P-value significance |
|
|
Control |
EPD |
-382.800 |
0.000 |
|
DIP |
-163.800 |
0.039 |
|
|
EPD |
DIP |
219.000 |
0.009 |
Table 5 Descriptive statistic (ANOVA test) for cellular proliferation in 8 days
|
|
N |
Mean |
Standard deviation |
F |
P-value significance |
|
Control |
5 |
2438.60 |
113.38 |
19.54 |
0.000 |
|
EPD |
5 |
2983.00 |
213.91 |
|
|
|
DIP |
5 |
2584.00 |
48.42 |
|
|
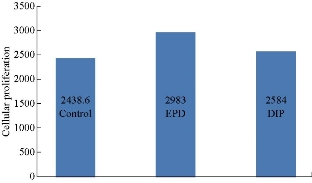
Fig. 7 Chart comparisons of different groups in 8-day proliferation assay.
Table 6 Multiple comparison (LSD) for cell proliferation assay in 8 days
|
|
Mean difference (I-J) |
P-value significance |
|
|
Control |
EPD |
-544.40 |
0.000 |
|
DIP |
-145.40 |
0.133 |
|
|
EPD |
DIP |
399.00 |
0.001 |
Discussion
In this study osteoblast cells were taken from 3-4 days old neonate rat due to its ability to form bone from the initial cell population. Thus, it was considered to have high growth potential. This agrees with the study of Taylor et al, [9] who found that the neonate rat osteoblast cell had a high growth potential. However, adult animals usually progress towards their “Hay flick limits” to be capable of the rapid expansion to high cell density required for true osteogenic differentiation. Extracellular pH used in this study was nearly 7.4 which was an important factor in the regulation of bone mineralization. Acidosis has an inhibitory action on matrix mineralization by inhibiting alkaline phosphatase (ALP) expression and activity while increasing mineral solubility [9].
Attachment and proliferation assay
This study revealed an increase in osteoblast cell attachment with increasing surface roughness which is identical to the clinical literature [14]. In fact, the control group had the least surface roughness (0.029 nm), and thus had the least number of attached cells, while the EPD-coated had the highest surface roughness (1.37 nm). Thus, it had the highest number of attached cells. On day 4 and 8 of this study, osteoblast proliferation in the control group was lower than the coated groups, The EPD group was superior to other coated groups in terms of either the absolute number or the division number of cells. There was copious cell distribution on surfaces of the discs. Coating of titanium discs with nanocomposite mixture (nano TiO2 and nano ZrO2) played an important role in increasing osteoblast attachment and proliferation on the coated disc as compared with uncoated titanium disc. This agrees with the findings of Basu et al. [15] who demonstrated that the nanometer grain sizes and high surface fraction of grain boundaries in nanoceramics displayed were responsible for the increased osteoblast functions (such as adhesion, proliferation and differentiation). Moreover, the adsorption of vitronectin (a protein known to mediate osteoblast adhesion) has been reported to be more pronounced on Nanophase ceramics. Also, the study found three benefits of the coating layer:
1. Coating with nanomaterial enhanced capacity to osteoblast attachment and then bone formation [17].
2. Coating layer composed of TiO2 and ZrO2 nanocomposite mixture was regarded as biocompatible layer which allowed cell growth [17].
3. Surface roughness was increased with coating technique as shown by AFM [5]. This also enhanced the attachment of osteoblast cells and proliferation.
Conclusions
From this study, it can be concluded that there is a significant increase in osteoblast cells attachment and proliferation of coated discs in comparison with uncoated discs. This improves the osseointegration. Electrophoretic deposition is a preferable method for the enhancement of bioactivity of the implant surface.
Acknowledgments
The authors would like to thank the Biotechnology Centre of Nahrain University, the University of Baghdad represented by Faculty of Dentistry / Prosthodontics Department, and the University of Kufa represented by the Faculty of Dentistry.
Conflict of Interests
The authors declare that they have no conflict of interest.
References
Copyright© Thekra Ismael Hamad, Rawaa Zaher Hassan Zwain, and Ali Mohammad Ali Aljafery. This is an open-access article distributed under the terms of the Creative Commons Attribution License, which permits unrestricted use, distribution, and reproduction in any medium, provided the original author and source are credited.

|
Nano Biomedicine and Engineering. Copyright © Shanghai Jiao Tong University Press |
 |