Research Article
Preparation of Cu2O Nanoparticles as a Catalyst in Photocatalyst Activity Using a Simple Electrodeposition Route
Hayder Khudhair Khattar 1*, Amer Mousa Juda 1, Fouad Abdul Ameer Al-aady 2*
1 Department of Chemistry, Faculty of Science, University of Kufa, Najaf, Iraq.
2 College of Pharmacy, University of Al-Mustansiriyah, Baghdad, Iraq.
* Corresponding authors. E-mail: khydr12@yahoo.com; dr.fouad.a@uomustansiriyah.edu.iq
Received: Jun. 6, 2018; Accepted: Aug. 12, 2018; Published: Dec. 4, 2018
Citation: Hayder Khudhair Khattar, Amer Mousa Juda, and Fouad Abdul Ameer Al-Saady, Preparation of Cu2O Nanoparticles as a Catalyst in Photocatalyst Activity Using a Simple Electrodeposition Route. Nano Biomed. Eng., 2018, 10(4): 406-416.
DOI: 10.5101/nbe.v10i4.p406-416.
In order to obtain inexpensive and effective application of catalyst for photodegradation, Cu2O powder was prepared by the simple and inexpensive electrodeposition method using surfactants such as glycerin (GLY), polyvinyl alcohol (PVA), poly(N-vinylpyrrolidone) (PVP) that helped the growth and nucleation of suspended particles. These particles were distinguished by atomic force microscopy (AFM), X-ray diffraction (XRD), field-emission scanning electron microscopy (FESEM) and high-resolution transmission electron microscopy (HRTEM). Diameter size of these obtained particles was found to reach to about 40 nm. In order to demonstrate the photodegradation efficiency of the copper oxide in the removal of organic malachite green oxalate (MG) dye, the catalyst was used both in calcination at 300 °C and without calcination. Parameters such as the amount of catalyst, the concentration of dye, the pH of dye sol, and the temperature were calculated. Pseudo first order reactions according to Langmuir-Hinshelwood kinetics could be obtained from the result of photocatalytic reactions. Parameters such as energy activation (Ea), enthalpy of activation (ΔH0), entropy of activation (ΔS0) and free energy of activation (ΔG0) were calculated. The activation energy was equal to 11.719 ± 1 and 11.083 ± 1 kJ/mol for MG dye in the presence of Cu2O nanoparticles in both two cases of calcination and without calcination respectively.
Keywords: Electrochemical deposition of Cu2O; Photochemical processing; Thermodynamic; Kinetic; Mechanism
Introduction
Nanotechnology is in a fast progress of development and its products are quite advantageous in all domains. Nanoparticles (NPs) display a major surface-to-size proportion when they are matched to macro and micro-materials [1]. Cuprous oxide is p-type semiconductor with direct band gap of 2.0 eV, the applications of which in solar energy transmutation, gas sensors, electronics, and magnetic storage have attracted large interests [2-4]. Electrodeposition, a chemical deposition, is a method to synthesize Cu2O nanocrystal of various shapes and sizes [5]. Properties of copper oxides have been studied through experiments and have been proven a promising photocatalyst in direct water splitting and organic contamination degradation under visible-light radiation [6, 7]. Cu2O can adsorb molecular oxygen effectively [8], which can clean the photogenerated electrons to inhibit the recombination of electron-hole pairs, and then develop the photocatalytic efficiency. Moreover, the essential properties of Cu2O include low toxicity and inexpensive price [9]. Octahedral Cu2O with bared {111} facets show extremely photocatalytic performance compared to cubes, making it a possible candidate for photocatalytic applications [10-12]. Advanced oxidation processes include the production of much interacting radicals, such as hydroxyl radicals, into least molecules, the entire mineralization of compounds into CO2 and H2O. The application of homogeneous photodegradation (single-phase system) to treat contaminated waters concerns the use of ultraviolet (UV)/ozone and UV/H2O2 [13]. Nanopwoder was characterized using atomic force microscopy (AFM), X-ray diffraction (XRD), field emission scanning electron microscope (FESEM), energy-dispersive X-ray spectroscopy (EDS), and transmission electron microscope (TEM).
Experimental
The method was simple and useful for generating NPs, which included using two electrodes, i.e. anode and cathode plates made of copper with high purity reaching to 99.99% with the scale of 2 cm, width of 2 cm and length of 1.5 mm. The two electrodes were placed facing each other in a vertical way with a distance of 6 cm between each other. The electrical cell that contained 100 mL deionized water (DW) was obtained from Faculty of Pharmacy, University of Kufa, Iraq. The electrolysis was employed at the temperature of 60 ℃ with continuous various voltages. The current passing in the circuit was monitored with a voltmeter. Additionally, the NPs were produced in a way of electrochemical reduction in changing the polarity of the direct current between the electrodes during electrolysis process, in order to obtain the better precipitation [14]. Electrolyte was used to prepare copper (I) oxide, with 25 g/100 mL NaCl (99% Thomas, Indi) at pH 8, and the distance for tow electrodes was 6 cm. A power supply under study (current DC 5 amp, maximum voltage 30 V, China) was utilized to supply and measure with more precision the current. Additives included glycerin (GLY), polyvinyl alcohol (PVA) and poly(N-vinylpyrrolidone) (PVP) (CDH-India). All the materials are listed in Table 1. Afterwards, the orange or red color of copper oxide powder was washed repeatedly with deionized water numerous times by using centrifugal; then washed twice with 99% ethanol and dried in an oven at 60 ℃ for 1h. Later, the deposited Cu2O was stored in tightly blocked vials, in a vacuum container containing silica gel powder [15].
Table 1 Chemicals and working conditions applied in the experiment of Cu2O powder electrodeposition of NaCl solutions
|
Chemicals |
PVP |
PVA |
Glycerin |
|
|
NaCl |
25 g / 100 mL |
25 g / 100 mL |
25 g / 100 mL |
25 g / 100 mL |
|
NaOH |
5 g / 100 mL |
1.5 mL |
1.5 mL |
1.5 mL |
|
K2Cr2O7 |
1 g / 100 mL |
1 mL |
1 mL |
1 mL |
|
Citric acid |
5 g / 100 mL |
1 mL |
1 mL |
1 mL |
|
Deionized water |
0.7 μs/cm |
0.7 μs/cm |
0.7 μs/cm |
0.7 μs/cm |
|
Glycerin |
1 g/100 mL |
-- |
-- |
20 mL |
|
PVA |
-- |
20 mL |
-- |
|
|
PVP |
1 g/100 mL |
20 mL |
-- |
-- |
|
pH |
8-9 |
8-9 |
8-9 |
8-9 |
|
Temperature |
50-60 ℃ |
50-60 ℃ |
50-60 ℃ |
50-60 ℃ |
|
General current density |
500 A/m2 |
500 A/m2 |
500 A/m2 |
500 A/m2 |
|
(Copper) Anode area |
8 cm2 |
8 cm2 |
8 cm2 |
8 cm2 |
|
Current density |
0.4 A |
0.4 A |
0.4 A |
0.4 A |
|
Voltage / Time |
-- |
3.4 V / 60 min |
3.5 V / 60 min |
3.8 V / 60 min |
Note: PVP = Poly(N-vinylpyrrolidone); PVA = Polyvinyl alcohol.
Result and Discussion
Characterization of Cu2O
Atomic force microscopy (AFM) measurements of Cu2O powder electrodeposition
AFM (CSPM-4000 Hitachi, Japan) of the Cu2O powder was prepared by electrical method using glycerin, PVA and PVP (20 mL) as stabilizer (Fig. 1). Fig. 1(a) shows distance among the metal oxide NPs was equal to 18 nm; Fig. 2(b) shows distribution of the metal oxide NPs was in three dimensions: X, Y and Z [16]. X and Y represent measurement of the area, and Z = 19.17 nm represents the height within nanoscale 0-100 nm. It could be observed that distribution of the copper oxide particles ranged from 60 to 140 nm (Fig. 1(c)). Average Granulite cubulation distribution of diameter for NPs Cu2O, when using 20 mL PVP, was 82.10 nm. Similarly, we noted the distribution of grain formed in PVA was 77.42 nm (Fig. 2), and was 56.64 nm in glycerin (Fig. 3).
Table 1 AFM measurements of Cu2O powder electrodeposition in NaCl solutions by using glycerin, PVP and PVA
|
CSPM Imager surface roughness analysis |
|||
|
Amplitude parameters |
|||
|
Cu2O |
PVP |
PVA |
GLY |
|
Roughness average (sa) (nm) |
4.0100 |
4.5300 |
2.5900 |
|
Root mean square (sq) (nm) |
4.7600 |
5.2100 |
2.9900 |
|
Surface skewness (Ssk) (nm) |
0.1050 |
0.0672 |
0.0001 |
|
Surface kurtosis (sku) (nm) |
2.1000 |
1.7900 |
1.8000 |
|
Sku = (3) mesokurtic, < (3) liptokurtic, > (3) platykurtic |
2.1000 > |
1.8000 > |
1.7900 |
|
Peak-peak (sy) (nm) |
19.5000 |
18.000 |
10.300 |
|
Ten point height (sz) (nm) |
19.5000 |
18.000 |
10.300 |
|
Hybrid parameters |
|||
|
Mean summit curvature (Ssc) [1/nm] |
-0.01730 |
-0.0135 |
-0.0105 |
|
Root mean square slope (sdq) [1/nm] |
0.2950 |
0.2670 |
0.2370 |
|
Surface area ratio (sdr) |
3.9200 |
3.4400 |
2.6600 |
|
Functional parameters |
|||
|
Surface bearing index (sbi) |
2.1300 |
5.3000 |
5.5800 |
|
Core fluid retention index (sci) |
1.5600 |
1.5100 |
1.4900 |
|
valley fluid retention index (svi) |
0.0836 |
0.0700 |
0.0692 |
|
Reduced summit height (spk) (nm) |
2.3600 |
2.7100 |
1.1000 |
|
Core roughness depth (sk) (nm) |
14.3000 |
14.700 |
9.0000 |
|
Reduced valley depth (svk) (nm) |
2.7800 |
0.5910 |
0.2630 |
|
Spatial parameters |
|||
|
Density of summits (Sds) [1/um2] |
250.00 |
363.00 |
308.00 |
|
Fractal dimension |
2.4400 |
2.1100 |
2.5200 |
|
Avg. diameter (nm) |
82.10 |
77.42 |
56.64 |
|
Voltaic (V)
|
3.4 |
3.5 |
3.8 |
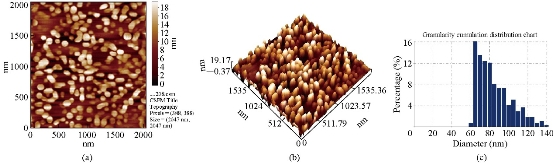
Fig. 1 AFM images of Cu2O powder electrodeposition in NaCl solutions with PVP (20 mL), avg. diameter = 82.10 nm: (a) 2-Dimensional image; (b) 3-Dimensinal image; (c) Granulite cubulation distribution chart.
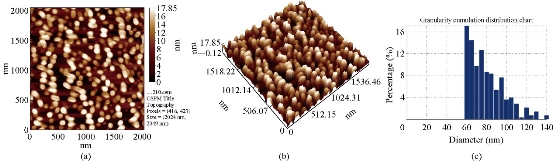
Fig. 2 AFM images of Cu2O powder electrodeposition in NaCl solutions with PVA (20 mL), avg. diameter = 77.42 nm: (a) 2-Dimensional image; (b) 3-Dimensinal image; (c) Granulite cubulation distribution chart.
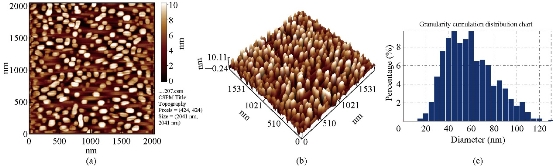
Fig. 3 AFM images of Cu2O powder electrodeposition in NaCl solutions with glycerin (20 mL), avg. diameter = 56.64 nm: (a) 2-Dimensional image; (b) 3-Dimensinal image; (c) Granulite cubulation distribution chart.
X-ray diffraction (XRD) measurements of Cu2O powder electrodeposition
The purity and crystal phases of Cu2O powder was tested by XRD. The XRD data came from employing a Shimadzu 6000 diffractometer equipped with Cu Kα ray (λ = 1.5406 Å) (at 40 mA and 50 KV) in zone 2θ from 20° to 80°. XRD patterns of the as-prepared samples were revealed in different conditions. In Fig. 4, diffraction peaks showed at 29.61°, 36.48°, 42.38°, 61.46°, 73.56° and 77.52°, identical to 110, 111, 200, 220, 311 and 222 planes of Cu2O, respectively, which indicated the formation of Cu2O nanocrystals according to JCPDS Card No. 05-0667 [17, 18]. The average crystalline size of Cu2O NPs was determined by taking the full width at half maximum (FWHM) of the most intense peak at 36.50° using Debye-Scherrer’s formula, which was of about 46.50 nm. The crystalline size calculated from XRD patterns was usually bigger than that from TEM images, which also occurred in our previous study [19].
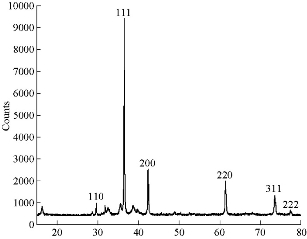
Fig. 4 X-ray images of Cu2O powder electrodeposition in NaCl solutions
Scanning electron microscope (SEM) measurements of Cu2O (NPs) electrodeposition with Gly, PVA, PVP
Field emission scanning electron microscopy (FESEM) (TESCAN, MIRA3, Czech) images (Fig. 5-7) show that range of the particle size of Cu2O NPs was 40-80 nm. The TEM form revealed that the prepared Cu2O NPs were particularly single crystals with twin boundaries (amorphous), as shown in Fig. 5. With the stabilizing agent GLY, it was found that the content of Cu in the Cu2O NPs was 86.72 w%, and with PVA it was 83.19 w%, and with PVP it was 71.44 w%. When the concentration of sample in glycerin (20 mL) was 1 g / 100 mL, octahedral Cu2O crystals were formed, SEM image showing the structure of Cu2O octahedron revealed the typical morphology of octahedral Cu2O (eight {111} faces) with about 40 nm in size (Fig. 5) [20]. TEM images from Philips CM300 300 kV High-Resolution Transmission Electron Microscope revealed the formation of octahedral Cu2O crystals, which was compatible with the results of XRD and SEM showing particles of eight {111} faces [21] (Fig. 5). When the sample with PVA (20 mL) was at the concentration of 1 g / 100 mL, hexapods Cu2O particles were formed with about 60 nm in size. It had eight and twenty-four {111} faces (Fig. 6). When 20 mL PVP from 1 g / 100 mL concentration was used as stabilizer, it can yield the cubic shape of Cu2O particles (having all six {110} faces) with formed uniform surface, and regular shape with particle size of about 80 nm according to the TEM size and SEM shape in nano scale (Fig. 7).
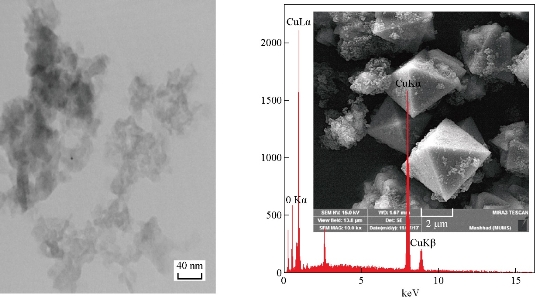
Fig. 5 SEM, EDS and TEM images of Cu2O NPs electrodeposition in NaCl with glycerin (20 mL), size = 40 nm, under vigorous stirring. Cu = 86.72 w%, O = 13.28 w%.
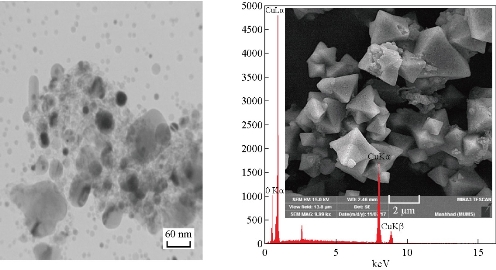
Fig. 6 SEM, EDS and TEM images of Cu2O NPs electrodeposition in NaCl with PVA (20 mL), size = 60 nm, under vigorous stirring. Cu = 83.19 w%, O = 16.81 w%.
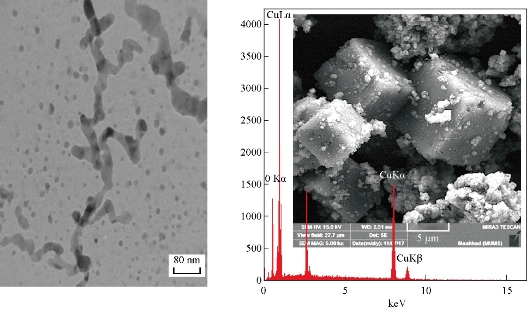
Fig. 7 SEM, EDS and TEM images of Cu2O NPs electrodeposition in NaCl with PVP (20 mL), size = 80 nm, under vigorous stirring. Cu = 71.44 w%, O = 28.56 w%.
Photodegradation of malachite green (MG) oxalate dye by Cu2O as catalyst
In order to prove in an electrical way the potential of copper oxide as a catalyst in the destruction of organic pollutants from pigments, wastewater or textile plants, and to satisfy the increasing demand for highly efficient and inexpensive catalysts, MG dye was studied with absorption of about 617 nm and good stability with visible light [22]. MG which is specific as a basic dye and a great water soluble dye related to the triphenylmethane family, M.wt 927.01 g/mol [34-36], was used to improve the photocatalytic properties. The cuprous oxide under study was used in tow phase calcined to 300 ℃, termed A, and without calcination was termed B. The homely photoreactor equipment mercury lamp-Philips-Holland (250W) without cover glass as a source for UV irradiation (Shimadzu UV 1650 PC Japan) was used to determine the declination degree of the MG dye solutions (LAB Tech, Hotplate. Korea). The space of lamp and solution glass was 15 cm. The test was carried out at 25 °C, and the compartment was closed to block escape of harmful radiation. The suspension pH values were adjusted at desired level using 0.01 N NaOH or 0.01 N HCl solutions, measured via pH meter (Hanna Tool). The water mixture was stirred magnetically during the amount of dye adsorbed and reduced was determined by change in the absorbance of MG dye using equation (1).
![]() , (1)
, (1)
where D % is the degradation ratio, Co is the initial concentration of dye solution, and Ca is the concentration of dyes after adsorption by the catalyst. Copper oxide obtained by electrostatic deposition method can be used in two cases in the process of photodegradation. Cu2O calcination at 300 ℃ was termed A and Cu2O without calcination was termed B.
Dark reaction of Cu2O catalyst in the absence of ultraviolet (UV) radiation
In dark reaction tests in the lack of UV beam, Cu2O was employed as a catalyst, as shows in Fig. 3. The results showed no deterioration in the loss of UV, where adding stimulation generated a slight change in the dye concentration. In an incubation time, the pigment concentration decreased slightly; after a limited period of time, it became fixed, where the monolayer configured on the surface of the catalyst, because of no active sites useful for extra adsorption. Hence, no additional lessening in dye concentrations was observed. Thus, the yield obtained from the tested absorption confirmed the low concentration of solutions (MG) which was due to the absorption of dyes over catalysts, and then no degradation of dyes was found. The conclusion showed that the balance occurred after 120 min. The percentage of decomposition efficiency was calculated at 76.825% and 78.185% for the Cu2O (A and B), respectively.
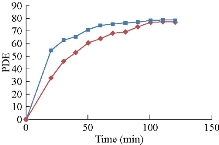
Fig. 8 The degradation efficiency of MG with A and B catalysts, in the absence of UV radiation.
Photodegradation of malachite green (MG) oxalate dye solution by ultraviolet (UV) irradiation in the absence of catalyst
Results of the photodegradation of MG dye solution, by UV irradiation in catalyst absence (Fig. 9) could be determined after 90 min of UV treating. The photodegradation efficiency (PDE%) could be observed as of 49.75% with ultraviolet radiation in catalyst absence.
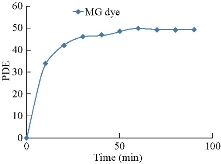
Fig. 9 The photodegradation efficiency of MG dyes without the catalyst.
Influence of the amount of catalyst
Influence of the amount of catalyst onto photocatalytic degradation for MG dyes was studied. The solution was examined under the exam provision with dye concentration of 4 ppm, light power 250 W, at 25 ℃ and variable of the mass of Cu2O NPs for both A and B in the range of 0.01-0.07 g in 100 mL. From 4 ppm of MG dye, if concentration of the photocatalyst crossed certain optimum value in the suspension, the penetration of light through the suspension reduced, causing decrease in the rate of decolourization of dye. Some studies explained that the rate of disintegration of the pollutant when increasing the amount of optical catalyst to the loss of a semiconductor molecule excited the state when it collided with other molecules that were not excited according to Equation (2) [23]. Thus, for executing any continuous research, the catalyst dose optimization is required before starting any photolysis process. In Fig. 10, for both copper oxides A and B, the best weight of Cu2O was 0.03, and 0.07 g for A and B respectively. PDE for Cu2O NPs both A and B was equal to 95.55% and 98.02 % respectively.
TiO2 + TiO2 * + TiO2 # → TiO2. (2)
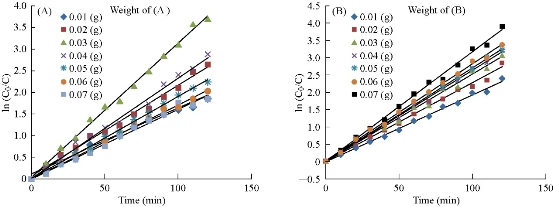
Fig. 10 (a) Effect of weight of Cu2O (A) on photodegradation efficiency of MG; (b) Effect of weight Cu2O (B) on photodegradation efficiency of MG.
The influence of pH solution
By studying the changes in pH solution in the range of 2-10 while maintaining other test conditions fixed: dye concentration of 4 ppm, light power of 250 W, catalyst dose of 0.03 g for sample (A), and 0.07 g for sample (B), at 25 ℃, The chamber had a variable pH initial solution for dye solutiоns. The results were observed in Fig. 3 and 11; the influence of the initial solution pH on the removal of MG by Cu2O NPs were shown. It can be seen that the adsorption percentage maintained very high, as of 99.97 and 97.53% for both cuprous oxides (A) and (B) respectively, in the pH range of 2-8. And then, the adsorption of MG decreased gradually from 94.85 and 89.71% to 87.09 and 84.34% for both cuprous oxides (A) and (B) respectively.
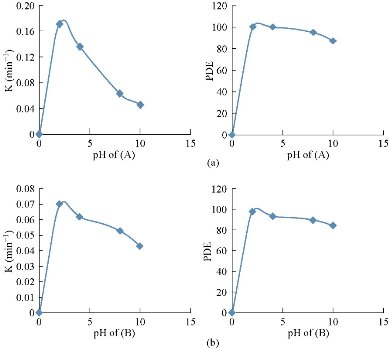
Fig. 11 Influence of pH on photocatalytic declination efficiency of MG (a) in the presence of 0.03g Cu2O (A), and (b) in the presence of 0.07 g Cu2O (B).
Influence of primary dye concentration
The influence of primary dye concentration on the photocatalytic degradation rate could be calculated by maintaining all other test conditions stable: light power = 250 W, рH = 2 at 25 ℃, 0.03 g for Cu2O (A) and 0.07 g for Cu2O (B), while changing the primary dye concentration in the domain of 1-7 pрm. Fig. 12 shows that the photocatalytic degradation rate was elevated with lowering of the initial dye concentration. This might be due to the length of the path of photon entering the dye solution that decreased with the increased concentration of the dye solution, which resulted in a fewer number of photons attached to the surface of the catalyst, Thus, the hydroxyl root (OH) and the superoxide (O2-) were lowering, leading to a reduction in the percentage of photolysis due to the lack of surface area exposed to excitement [24, 25].
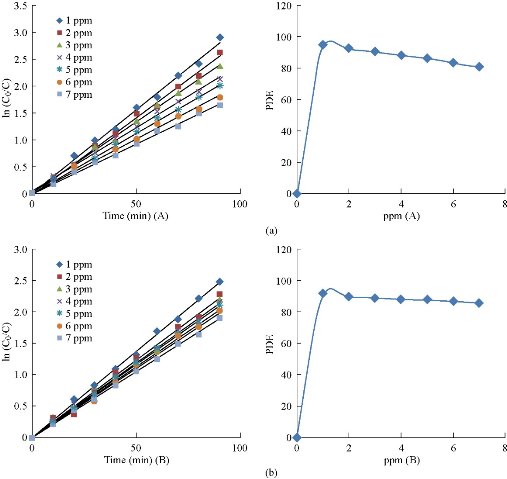
Fig. 12 The variable in photocatalytic degradation efficiency for MG dye with concentration (a) in the presence of 0.03 g Cu2O (A), and (b) in the presence of 0.07 g Cu2O (B).
Influence of varied temperature
Table 2 shows the activation energy for photocatalytic degradation in MG solution using the cuprous oxide: 0.03 g Cu2O (A) and 0.07 g Cu2O (B). The catalyst in the temperature range of 303-318 K equaled 11.719 ± 1 and 11.083 ± 1 kJ/M, respectively.
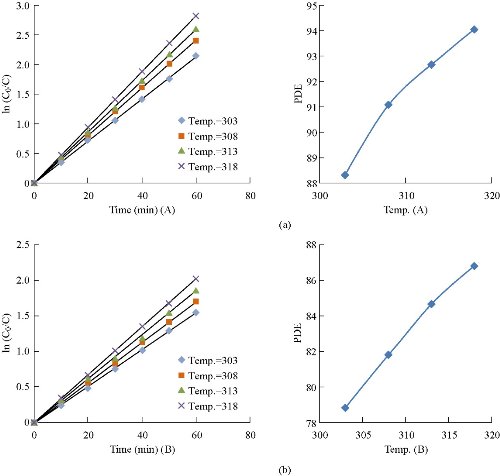
Fig. 13 Influence of photocatalytic degradation efficiency of MG at varied temperature (a) in the presence 0.03 g Cu2O (A), and (b) in the presence of 0.07 Cu2O (B).
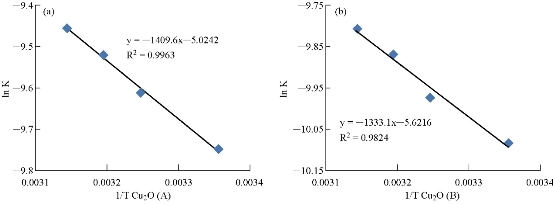
Fig. 14 Arrhenius plot of MG dye with (a) 0.03 g Cu2O (A) and (b) 0.07 g Cu2O (B).
Table 2 Values of rate constant, kinetics and thermodynamic parameters for the photocatalytic degradation of MG dye at 303-318 K, with 0.03 g Cu2O (A) and 0.07 g Cu2O (B).
|
T (kº)
|
1/T |
K (sec-1) ×10-5
|
ln K |
Ea (kJ mol-1) |
ΔH# (kJ mol-1) |
ΔS# (kJ mol-1 k-1) |
ΔG# (kJ mol-1) |
||||||
|
Cu2O B |
Cu2O A |
Cu2O B |
Cu2O A |
Cu2O B |
Cu2O A |
Cu2O B |
Cu2O A |
Cu2O B |
Cu2O A |
Cu2O B |
Cu2O A |
||
|
303 |
0.00330 |
4.166 |
5.833 |
-10.085 |
-9.749 |
11.083 |
11.719 |
8.564 |
9.200 |
-0.250 |
-0.286 |
84.495 |
95.850 |
|
308 |
0.00324 |
4.660 |
6.698 |
-9.973 |
-9.611 |
8.522 |
9.158 |
85.706 |
97.246 |
||||
|
313 |
0.00319 |
5.166 |
7.329 |
-9.870 |
-9.521 |
8.481 |
9.117 |
86.918 |
98.635 |
||||
|
318 |
0.00314 |
5.500 |
7.833 |
-9.808 |
-9.454 |
8.439 |
9.075 |
88.129 |
100.023 |
||||
Conclusions
The preparation of cuprous oxide NPs was carried out successfully by electrochemical rout, in an easy, inexpensive and highly precise manner to control the size and shape within nanometer scale. The prepared NPs were characterized by XRD, FESEM, EDX, TEM and AFM. To improve the catalytic performance of photodegradation and to enhance crystallization, the powder was calcined to 300 °C (A), To test the catalytic performance, Cu2O calcination was compared with Cu2O without calcination (B). For degradation of the sol malachite green dye, the product photocatalytic reactions suggested that the model was pseudo-first order reaction represented by the Langmuir-Hinshelwood model. The thermodynamic parameters referred to that positive ΔH0 was certain on endothermic reaction. The positive ΔG0 result indicated that the non-spontaneous reaction was of clear high positive ΔG0, which was because the activated case was solvated structure established between the dye molecules and the reaction mediate that was hydroxyl radicals. This was also confirmed by the negative entropy of activation ΔS0 which was negative and more ordered to the reactant. The reactive species such as hydroxyl radical and superoxide anion were produced from the heterogeneous photocatalytic reaction. The products of the fragmentation of the dye by the catalyst were CO2 and H2O. Future work should be the production of low-cost semiconductors capable of eliminating organic pollutants in an easy, simple and controlled electrochemical way.
Conflict of Interests
The authors declare that no competing interest exists.
References
Copyright© Hayder Khudhair Khattar, Amer Mousa Juda, and Fouad Abdul Ameer Al-Saady. This is an open-access article distributed under the terms of the Creative Commons Attribution License, which permits unrestricted use, distribution, and reproduction in any medium, provided the original author and source are credited.

|
Nano Biomedicine and Engineering. Copyright © Shanghai Jiao Tong University Press |
 |