Research Article
Spectrophotometric Determination of Etilefrine HCl, Salbutamol Sulphate and Tiemonium Methyl Sulphate Using Surface Plasmon Resonance Band of Gold Nanoparticles
Magda Mohamed Ayad, Hisham Ezzat Abdellatef, Mervat Mohamed Hosny, Naglaa Abdel-Sattar Kabil *
Department of Analytical Chemistry, Faculty of Pharmacy, Zagazig University, Zagazig, Egypt.
* Corresponding author. E-mail: nagla_kabil@yahoo.com
Received: Dec. 7, 2017; Accepted: Jan. 25, 2018; Published: Feb. 16, 2018
Citation: Magda Mohamed Ayad, Hisham Ezzat Abdellatef, Mervat Mohamed Hosny, and Naglaa Abdel-Sattar Kabil, Spectrophotometric Determination of Etilefrine HCl, Salbutamol Sulphate and Tiemonium Methyl Sulphate Using Surface Plasmon Resonance Band of Gold Nanoparticles. Nano Biomed. Eng., 2018, 10(1): 16-24.
DOI: 10.5101/nbe.v10i1.p16-24.
Abstract
A simple and sensitive method was developed for spectrophotometric determination of etilefrine hydrochloride, salbutamol sulphate and tiemonium methyl sulphate in pure form and in their pharmaceutical formulations. The method was based on reduction of gold solution to gold nanoparticles by the studied drugs in presence of sodium dodecyl sulphate as stabilising agent. Gold nanoparticles (Au NPs) showed a new absorption band at 530 nm that was used for quantitative determination of the cited drugs. Different variables were examined and optimised in the experiment as gold solution concentration, type of buffer, suitable pH, stabilising agent, order of addition, time and temperature of the reaction. Under optimum conditions, the calibration curves were linear with concentration ranges of 3.0-20.0, 5.0-18.0 and 2.0-26.0 μg/mL for etilefrine Hydrochloride, salbutamol sulphate and tiemonium methyl sulphate respectively. The method was applied successfully to determine the studied drugs in pure form and in their pharmaceutical dosage forms, exhibiting good reproducibility and accuracy.
Keywords: Gold nanoparticles; Etilefrine Hydrochloride; Salbutamol sulphate; Tiemonium methyl sulphate
Introduction
Etilefrine hydrochloride is [2-ethylamino-1-(3-hydroxyphenyl) ethanol hydrochloride] [1a]. It is a direct-acting sympathomimetic with beta1-agonist properties, and some alpha-and beta2-agonist actions. It is used for the treatment of hypotensive states [2a]. Different techniques were reported for the determination of etilefrine hydrochloride including: spectrophotometry [3-7], spectro flourimetry [8] and HPLC [9]. Salbutamol sulphate is [Bis [(1RS)-2- [(1, 1-dimethylethyl) amino]-1- [4-hydroxy-3-(hydroxmethyl) phenyl] ethanol] sulphate] [1b]. It is a direct-acting sympathomimetic with mainly beta-adrenergic activity and a selective action on beta2 receptors (a beta2 agonist). It is used as bronchodilators in the management of reversible airways obstruction, as in asthma and in some patients with chronic obstructive pulmonary disease. It also decreases uterine contractility and may be given as the sulfate to arrest premature labour [2b]. Different methods were reported for determination of salbutamol sulphate including spectrophotometry [10-15], HPLC [16, 17], thin layer chromatography [18], capillary electrophoresis [19] and voltammetry [20]. Tiemonium methyl sulphate (TIM) is 4-[3-Hydroxy-3-phenyl-3-(2-thienyl) propyl]-4-methyl-morpholinium methylsulphate. It is quaternary ammonium antimuscarinics which is used in the relief of visceral spasms [2c] .The drug is not included in any official pharmacopeias till now. From the literature survey, there were few methods had been reported for its determination using spectroscopic methods [21-23] .Chromatographic methods had been applied [24, 25]. However, some of these methods are expensive, somewhat time consuming; they require expensive instruments, which make it unavailable in many laboratories for the analysis of the cited drugs in biological samples. It is important to develop a simple and sensitive method for their determination. Recently simple colorimetric methods have been widely used in analytical areas due to their low cost, simplicity and practically. Noble metal nanoparticles have attracted much interest in modern chemistry due to their unique optical properties. When gold nanoparticles and silver nanoparticles are dispersed in liquid media, solutions show a distinctive color attributed to their small size and they exhibit a strong UV-Vis extinction band. Gold nanoparticles have wide applications in various area of chemistry [26-27]. In this work, gold nanoparticles were synthesized using the reducing capacity of the cited drugs in presence of stabilizing agent. The synthesized nanoparticles were used for their quantitative determination in pure and pharmaceutical formulations.
Experimental
Instrumentation
A single cell holder JENWAY 6715 UV/ Visible spectrophotometer equipped with 10 mm matched quartz cells was employed for all absorbance measurements
Materials and reagents
All solvents and reagents used were of the highest purity. Etilefrine hydrochloride, obtained from Chemical Industrial Development (Cid). Its purity was found to100.26% according to the comparison method. Salbutamol sulphate, obtained from Pharco Pharmaceuticals. Its purity was found to100% according to the comparison method. TIM, obtained from Adwia Pharmaceutical Industries Co., Egypt. Its purity was found to be 99.9% as reported from company and 100.22% according to the comparison method. Gold (III) solution: 1g of chloroauric acid (Fischer chemical, Fischer scientific UK limited, U.K.) was dissolved in distilled water. The solution was made up to the mark in 100 mL volumetric flask. Phosphate buffer (pH 7.5, 0.2 mol) was prepared by dissolving 27.22 g of potassium dihydrogen orthophosphate in 930 mL of water, adjusting pH of the solution to 7.5 with a 30% w/v solution of potassium hydroxide and adding sufficient water to produce 1000 mL phosphate buffer [1]. A solution of 2.0 g/L sodium dodecyl sulphate (SDS) (Sigma Aldrich, Germany).
Pharmaceutical preparations
Effortil® tablets containing 5.0 mg etilefrine hydrochloride per tablet, obtained from Chemical Industrial Development (Cid) under the licence of Boehringer Ingelheim, Germany, batch No 01160039. Effortil® drops containing 7.5 mg etilefrine hydrochloride per gram solution (obtained from Chemical Industrial Development (Cid) under the licence of Boehringer Ingelheim, Germany), batch No 12160292. Salbovent Fotre® tablets containing 4.8 mg salbutamol sulphate per tablet (obtained from Alex. Co. for Pharmaceuticals and Chemical Industries), batch No 6172028. Farcolin® respiratory solution containing 0.121 g salbutamol sulphate per 20.0 mL solution (obtained from Pharco Pharmaceuticals), batch No 1404. Ventolin® syrup containing 2.0 mg salbutamol sulphate per 5.0 mL (obtained from Galaxosmithkline), batch No 7221009. Salbovent® ampoule containing 0.6025 mg salbutamol sulphate per 1.0 mL (obtained from Alex. Co. for Pharmaceuticals and Chemical Industries), batch No 2418008. Visceralgine® tablets containing 50.0 mg Timonium methylsulphate per tablet (obtained from Sedico Pharmaceutical Company, Giza, Egypt), batch No. 0916299. Viscera® ampoules containing 5.0 mg Timonium methylsulphate per 2.0 mL (Sedico Pharmaceutical Company, Giza, Egypt), batch No. 1216287/A.
Standard solutions
10.0 mg of etilefrine hydrochloride, salbutamol sulphate and TIM were weighed accurately and transferred into a 10.0 mL standard flask, dissolved and made up to mark with bidistilled water and then further diluted to100 µg/mL for the studied drugs.
General procedure
Different aliquots of the studied drug solutions were added into 5.0 mL volumetric flask containing appropriate volumes of phosphate buffer solution of pH 7.5, gold(III) (2%) solution and SDS solution according to a certain sequence. The contents were heated in boiling water bath for appropriate times and then diluted to mark with distilled water .After cooling the solution to room temperature; absorbance was measured at suitable wavelength against reagent blank treated similarly (Table 1).
Table 1 Analytical parameters and spectral data for determination of etilefrine hydrochloride (HCl), salbutamol sulphate and TIM through gold nanoparticles formation
|
Parameter |
Etilefrine HCl |
Salbutamol sulphate |
TIM |
|
λmax (nm) |
530 |
530 |
529 |
|
Volume of phosphate buffer, pH 7.5 (mL) |
0.5 |
0.5 |
-- |
|
Volume of SDS, 0.2% w/v (mL) |
1.5 |
0.5 |
1.0 |
|
Volume of gold solution, 2% v/v (mL) |
2.0 |
1.5 |
2.0 |
|
Temperature (oC) |
100 |
100 |
100 |
|
Time of heating (min) |
20 |
20 |
10 |
|
Linearity range (μg/mL) |
3.0 - 20.0 |
5.0 - 18.0 |
2.0 - 26.0 |
|
Apparent molar absorptivity* (/mol/cm) |
9.04 x 10³ |
1.4600 × 10⁴ |
1.56 × 10⁴ |
|
Limit of detection (LOD) (μg/mL) |
0.895 |
1.625 |
0.610 |
|
Limit of quantification (LOQ) (μg/mL) |
2.984 |
4.924 |
2.032 |
|
Regression equation: Slope (b) Intercept (a) Correlation coefficient (r) |
0.0422 -0.0059 0.9999 |
0.0310 -0.0562 0.9999 |
0.0271 0.0808 0.9999 |
* Calculated on the basis of the molecular weight of the drug.
Assay of pharmaceutical preparations
Assay of tablets
effortil® and salbovent Fotre® tablets
Ten tablets were weighed, pulverized into fine powder, in 10.0 mL volumetric flask specific quantity of powdered tablet drugs equivalent to 10.0 mg pure drug were dissolved and diluted to mark using distilled water. Solutions were filtered and then further diluted to100 µg/mL with distilled water. Procedures were completed as in general procedures by applying the standard addition technique.
visceralgine® tablets
Ten tablets were weighed, pulverized into fine powder, in 10.0 mL volumetric flask specific quantity of powdered tablet drugs equivalent to 10.0 mg pure drug were dissolved and diluted to mark using methanol then sonicated for 30 min. Solutions were filtered and then further diluted to100.0 µg/mL with distilled water. Procedures were completed as in general procedures by applying the standard addition technique.
ventolin® syrup
2.5 mL syrup was placed in 10.0 mL volumetric flask and diluted to 10.0 mL with distilled water. Procedures were completed as in general procedures applying standard addition technique.
effortil® and farcolin® drops
A specific volume of drop solutions equivalent to 10.0 mg pure drug were placed in 100.0 mL volumetric flask and diluted to 100.0 mL with distilled water for etilefrine HCl and salbutamol sulphate. Procedures were completed as in general procedures by applying the standard addition technique.
salbovent® and viscera® ampoule
A specific volume of ampoule solutions equivalent to 10.0 mg pure drug were placed in 100.0 mL volumetric flask and diluted to 100.0 mL with distilled water for salbovent and with 50% methanol (v/v) for viscera. Procedures were completed as in general procedures by applying the standard addition technique.
Spiking of TIM into plasma and their extraction from plasma (By protein precipitation method)
From the standard solution containing 1000 μg/mL of TIM, 0.5 mL was pipetted out and spiked into 0.5 mL of plasma in a centrifuge tube. Then, 4 mL of acetonitrile was added to the tube and centrifuged for 30 min at 5000 rpm. The supernatant liquid was collected in another tube and 0.1 mL supernatant was added to different concentrations of pure drug and the procedures were completed as in general procedures applying standard addition technique.
Results and Discussion
Nanoparticles made of silver and gold have been the focus of research for many decades due to their intriguing optical properties. In this study, an aqueous gold solution that contained SDS, as stabilizer and phosphate buffer solution was added to etilefrine HCl, salbutamol sulphate and TIM solutions. Upon addition of the cited drugs which acted as the reducing agent, gold ions reduced to gold nanoparticles and then the absorbance characteristic to the plasmon of the Au-NPs was observed (530 nm) (Fig. 1).
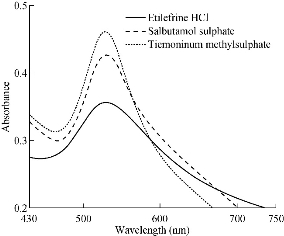
Fig. 1 Absorbance spectra of the gold nanoparticles formed in the presence of 8.5 µg/mL etilefrine HCl, 15.5 µg/mL salbutamol sulphate and 14 µg/mL TIM.
Effect of pH
The reaction between the studied drugs and the gold solution was a redox reaction, and since H+ was produced from the reaction between the cited drugs and gold ions, its removal could accelerate the reduction of gold ions. With different buffer media as the acetate, phosphate and borate were tried within a wide range of pH from pH 1 to pH 12.5. The optimum buffer medium was phosphate buffer at pH 7.5. The absorbance of drugs increased up to pH 7.5 and then started to decrease, which might be attributed to the formation of gold hydroxide. Thus, 0.5 mL of phosphate buffer was sufficient for the reaction of etilefrine and salbutamol, while TIM reduced gold solution with no need of buffer (Fig. 2 and 3; Table 1).
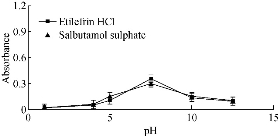
Fig 2 Effect of variation of pH on the absorbance of gold nanoparticles formed through the reaction of gold solution and SDS in presence of 15 µg/mL etilefrine HCl and 18 µg/mL salbutamol sulphate.
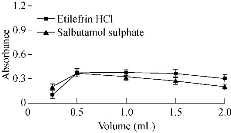
Fig 3 Effect of volume of buffer solution on the absorbance of gold nanoparticles formed through the reaction of gold solution and SDS in presence of 15 µg/mL etilefrine HCl and 18 µg/mL salbutamol sulphate.
Effect of stabilizer
Stabilization of the formed gold nanoparticles was very crucial to prevent their aggregation. Different surfactants such as SDS, cetyl trimethyl ammonium bromide (CTAB) and methyl cellulose were tried. In presence of CTAB, the intensity of absorbance of Au NPs decreased in comparison with when SDS was used. This might be attributed to the agglomeration of nanoparticles; hence, SDS was the best one that prevented aggregation through steric stabilization. Different concentrations and volumes of SDS were added to the reaction mixture. Additions of 1 mL, 0.5 mL and 1.5 mL of 0.2% SDS were chosen as the optimum value for etilefrine HCl, salbutamol sulphate and TIM respectively (Fig. 4 and 5; Table 1).
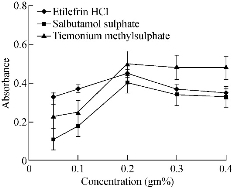
Fig. 4 Effect of concentration of SDS solution on the absorbance of gold nanoparticles formed through the reaction of buffer and gold solution in presence of 15 µg/mL etilefrine HCl, 18 µg/mL salbutamol sulphate and 20 µg/mL TIM.
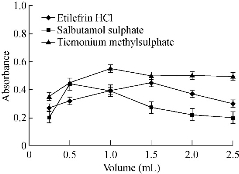
Fig. 5 Effect of volume of SDS solution on the absorbance of gold nanoparticles formed through the reaction of buffer and gold solution in presence of 15 µg/mL etilefrine HCl, 18 µg/mL salbutamol sulphate and 20 µg/mL TIM.
Effect of gold solution concentration
Maximum absorbance values were obtained using 2.0 mL, 1.5 mL and 2.0 mL of 2% v/v gold solution for etilefrine HCl, salbutamol sulphate and TIM respectively (Fig. 6 and 7; Table 1).
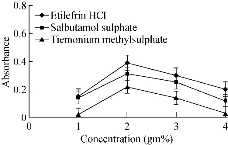
Fig. 6 Effect of concentration of gold solution on the absorbance of gold nanoparticles formed through the reaction of buffer and SDS in presence of 15 µg/mL etilefrine HCl, 18 µg/mL salbutamol sulphate and 20 µg/mL TIM.
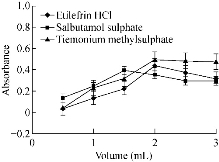
Fig. 7 Effect of volume of gold solution on the absorbance of gold nanoparticles formed through the reaction of buffer and SDS in presence of 15 µg/mL etilefrine HCl, 18 µg/mL salbutamol sulphate and 20 µg/mL TIM.
Effect of temperature and time of heating
Heating in water bath at 100 °C for 20, 20 and 10 min was sufficient to produce maximum color intensities for etilefrine HCl, salbutamol sulphate and TIM respectively (Fig. 8 and 9; Table 1).
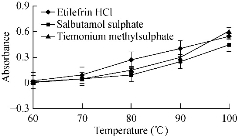
Fig. 8 Effect of temperature on the absorbance of gold nanoparticles formed through reaction of buffer, SDS and gold solution in presence of 15 µg/mL etilefrine HCl, 18 µg/mL salbutamol sulphate and 20 µg/mL TIM.
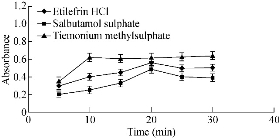
Fig. 9 Effect of time of heating on the absorbance of gold nanoparticles formed through reaction of buffer, SDS and gold solution in presence of 15 µg/mL etilefrine HCl, 18 µg/mL salbutamol sulphate and 20 µg/mL TIM.
Effect of order of addition
The sequence of addition of the constituents for formation of gold nanoparticles was studied. The most suitable order was drug, gold, SDS and buffer for etilefrine HCl, drug, buffer, SDS and gold for salbutamol sulphate, while drug, SDS and gold was found the best sequence for tiemonium sulphate. Other sequences gave lower absorbance values (Fig. 10; Table 1).
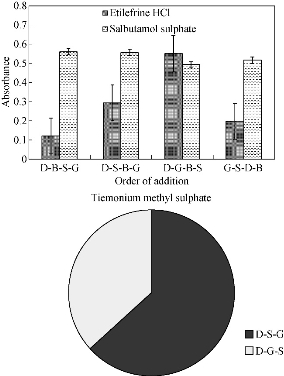
Fig. 10 Effect of order of addition of phosphate buffer, SDS and gold solution to 15 µg/mL etilefrine HCl, 18 µg/mL salbutamol sulphate and 20 µg/mL TIM.
* D = drug; B = buffer; S = SDS; G = gold solution.
Method validation
Linearity
Under the optimum conditions described, calibration curves for determination of the cited drugs by the proposed method were constructed by plotting absorbance against drug concentrations. Beer’s law plots were linear over the range of 3 - 20 μg/mL, 5 - 18 μg/mL and 2 - 26 μg/mL for etilefrine HCl, salbutamol sulphate and tiemonium methylsulphate respectively, with small intercepts and good correlation coefficients indicating good linearity over the working concentration ranges. Molar absorbtivity, relative standard deviation, analytical standard error, detection and quantification limits were also calculated and listed in Table 1.
Sensitivity
The LOD and LOQ were evaluated using the following equations according to guidelines by the International Council for Harmonisation of Technical Requirements for Registration of Pharmaceuticals for Human Use (ICH):
![]() , and
, and ![]() ,
,
where σ = the standard deviation of replicate blank responses (under the same conditions as for sample analysis), and s = the slope of the calibration curve. LODs and LOQs were calculated and listed (Table 1).
Accuracy and precision
Accuracy
The accuracy of the proposed method was ascertained by determining pure samples of the cited drugs with reported methods. Statistical analysis of the results obtained by the proposed and comparison methods for the studied drugs showed that the calculated values didn't exceed the theoretical ones, which indicated no significant differences were found between the proposed method and comparison methods. Statistical comparison of the results was performed using Student’s t-test and variance ratio F-test at 95% confidence level.
Precision
Intra-day precision (repeatability)
To determine intra-day precision of the proposed method, solutions containing three different concentrations (within the linearity ranges) of each drug in its pure form were prepared and analyzed by proposed method on three successive times in the same day. The values of relative standard deviation and percentages relative error (Er %) of the suggested method was calculated using the following equation:
![]()
Inter-day precision (intermediate)
To establish inter-day precision, three experimental replicates including three different concentrations (within the linearity ranges) of the cited drugs were carried out using proposed method over a period of three days. Relative standard deviation and percentages relative error (Er %) were calculated.
Selectivity
To study the selectivity of the proposed method, interference liabilities were performed to explore the effect of common excipients that might be added during formulations. Under the experimental condition employed, to known concentrations of the cited drugs, the common excipients as lactose, calcium carbonate, sodium chloride, sucrose, magnesium stearate, talc and starch were added and analyzed. Results showed no interferences from the presence of these excipients (Table 2).
Table 2 Analysis of the cited drugs by the proposed method in presence of some common excipients
|
Tolerance molar ratio (M : M) * |
Recovery % ** |
|||||
|
Etilefrine HCl |
Salbutamol sulphate |
TIM |
||||
|
|
|
Lactose |
Calcium carbonate |
Lactose |
Sodium chloride |
Sucrose |
|
1:1 |
-- |
100.04 |
101.33 |
100.41 |
95.79 |
104.10 |
|
1:10 |
-- |
98.02 |
102.25 |
101.33 |
95.42 |
103.17 |
|
1:50 |
-- |
102.06 |
102.07 |
102.07 |
95.24 |
97.64 |
|
1:100 |
-- |
101.05 |
103.17 |
102.07 |
95.06 |
99.48 |
|
Other excipients |
Etilefrine HCl |
Salbutamol sulphate |
TIM |
|||
|
Magnesium stearate (40µg/mL) |
95.66 |
96.01 |
95.79 |
|||
|
Talc (40µg/mL) |
101.58 |
100.04 |
103.17 |
|||
|
Starch (40µg/mL) |
98.62 |
96.01 |
-- |
|||
*Drug: Excipients, etilefrine HCl 16 μg/mL (7.4x10⁻³ mol), salbutamol sulphate 16 μg/mL (6.7×10⁻³ mol) and TIM 20 μg/mL (4.7×10⁻³ mol).
** Mean of three determinations.
Robustness and ruggedness
Robustness
It was the measure of the capacity of proposed method to remain unaffected by small variations of the method variables. It was evaluated by making small incremental changes in one parameter while the others were kept unchanged as the volume of gold solution (2.1, 2.0, 1.9 mL for etilefrine HCl, 1.6, 1.5, 1.4 mL for salbutamol sulphate and 2.1, 2.0, 1.9 mL for TIM), phosphate buffer volume (0.55, 0.50, 0.45 mL for etilefrine HCl and salbutamol sulphate ) and SDS volume (1.6, 1.5, 1.4 mL for etilefrine HCl and salbutamol sulphate and 1.1, 1.0, 0.9 mL for TIM). The effect of the changes were studied on the absorbance by calculating recovery ± %RSD, and the changes had negligible influence on the results, which provided an indication for the reliability of the proposed method during its routine application for analysis of the investigated drugs (Table 3).
Table 3 Method robustness and ruggedness expressed as (recovery ± RSD%).
|
|
Robustness |
Ruggedness |
|||
|
Parameters altered |
Inter-instruments (n=2) |
||||
|
Drugs |
Taken (μg/mL) |
Volume of gold solution |
Volume of phosphate buffer |
Volume of SDS |
JENWAY6715UV/Vis. -ShimadzuUV1800 PC |
|
Etilefrine HCl |
4.0 |
102.63 ± 1.453 |
102.82 ± 1.450 |
99.07 ± 1.922 |
100.06 ± 1.675 |
|
Salbutamol sulphate |
14.0 |
97.20 ± 1.216 |
97.28 ± 1.441 |
97.20 ± 1.216 |
97.05 ± 1.679 |
|
TIM |
20.0 |
99.91 ± 1.128 |
-- |
98.75 ± 1.483 |
99.48 ± 1.311 |
Ruggedness
It was tested by applying the proposed method to the assay of the investigated drugs using the same procedures but using two different instruments. The obtained results were found to be reproducible as shown in (Table 3).
Analytical applications
The proposed method was successfully applied to the assay of the studied drugs in their pharmaceutical formulations and in plasma sample for TIM without interference from common excipients. Satisfactory results obtained from the recoveries of the drugs were in good agreement with the label claim and proved the suitability of the proposed method (Table 4 and 5).
Table 4 Determination of etilefrine HCl and salbutamol sulphate in their pharmaceutical formulations
|
|
Etilefrine HCl |
Salbutamol sulphate |
||||||||||||
|
|
Effortil tablets |
Effortil drops |
Salbovent Forte® tablets |
Farcolin® respiratory solution |
Ventolin® syrup |
Salbovent® ampoule |
||||||||
|
|
Taken (µg/mL) |
Added (µg/mL) |
Recovery * (%) |
Added (µg/mL) |
Recovery * (%) |
Taken (µg/mL) |
Added (µg/mL) |
Recovery * (%) |
Added (µg/mL) |
Recovery * (%) |
Added (µg/mL) |
Recovery * (%) |
Added (µg/mL) |
Recovery * (%) |
|
|
3.0 |
-- 3.0 4.0 7.0 9.0 14.0 16.0 |
95.50 99.45 98.28 98.48 98.18 97.99 96.40 |
-- 4.0 5.0 7.0 13.0 15.0 |
104.98 100.06 99.00 101.18 99.14 99.35 |
5.0 |
-- 5.0 7.0 9.0 11.0 13.0 |
100.77 100.77 99.63 98.28 99.47 99.06 |
-- 5.0 7.0 9.0 11.0 13.0 |
104.65 101.42 100.09 100.43 98.89 99.06 |
-- 5.0 7.0 9.0 11.0 13.0 |
104.00 100.77 101.47 99.00 100.06 99.31 |
-- 5.0 7.0 9.0 13.0 |
104.65 100.77 99.63 99.35 99.31 |
|
Mean *± SD N V S.E. |
98.13 + 0.989 6 0.978 0.404 |
99.75 + 0.899 5 0.809 0.402 |
99.44 + 0.910 5 0.828 0.407 |
99.98 + 1.041 5 1.084 0.466 |
100.12 + 1.024 5 1.048 0.458 |
99.77 + 0.687 4 0.472 0.344 |
||||||||
* Mean of three different experiments
Table 5 Determination of tiemonium methylsulphate in its pharmaceutical formulations and in plasma sample
|
|
Visceralgin® tablets |
Visceralgin ® ampoule |
Plasma sample |
||||||
|
|
Taken (µg/mL) |
Added (µg/mL) |
Recovery* (%) |
Taken (µg/mL) |
Added (µg/mL) |
Recovery* (%) |
Taken (µg/mL) |
Added (µg/mL) |
Recovery* (%) |
|
|
4.0
|
-- 2.0 4.0 6.0 8.0 10.0
|
97.97 96.31 96.13 96.68 97.88 96.75 |
4.0 |
-- 4.0 6.0 8.0 14.0 16.0 |
95.20 95.20 95.45 96.96 96.26 95.99
|
2.0 |
--- 4.0 6.0 8.0 12.0 14.0 16.0 |
96.31 97.97 96.06 95.11 95.69 96.52 95.06 |
|
Mean * ± SD N V S.E. |
96.75 + 0.682 5 0.465 0.305 |
95.97 + 0.692 5 0.479 0.309 |
96.07 ± 1.085 6 1.177 0.443 |
||||||
Conclusions
The proposed method was found to be simple, economic, selective and sensitive. The statistical parameters and recovery study data clearly indicated the reproducibility and accuracy of the methods. The proposed method was successfully applied for the determination of the studied drugs in their pharmaceutical formulation without interference from the common excipients.
Acknowledgements
The authors wish to acknowledge the support of this work by Department of Analytical Chemistry, Faculty of Pharmacy, Zagazig University, Egypt.
Conflict of Interests
The authors declare that no competing interest exists.
References
Copyright© Magda Mohamed Ayad, Hisham Ezzat Abdellatef, Mervat Mohamed Hosny, and Naglaa Abdel-Sattar Kabil. This is an open-access article distributed under the terms of the Creative Commons Attribution License, which permits unrestricted use, distribution, and reproduction in any medium, provided the original author and source are credited.

|
Nano Biomedicine and Engineering. Copyright © Shanghai Jiao Tong University Press |
 |