Research Article
Formulation and Evaluation of Cox-2 Inhibitor (Etoricoxib) Loaded Ethyl Cellulose Nanoparticles for Topical Drug Delivery
Abbaraju Krishna Sailaja *, Naheed Begum
Department of Pharmaceutics, RBVRR Women’s College of Pharmacy Affiliated to Osmania University, Barkatpura, Hyderabad, India.
* Corresponding author. E-mail: shailaja1234@rediffmail.com
Received: Oct. 20, 2017; Accepted: Dec. 25, 2017; Published: Jan. 26, 2018
Citation: Abbaraju Krishna Sailaja, Naheed Begum, Formulation and Evaluation of Cox-2 Inhibitor (Etoricoxib) Loaded Ethyl Cellulose Nanoparticles for Topical Drug Delivery. Nano Biomed. Eng., 2018, 10(1): 1-9.
DOI: 10.5101/nbe.v10i1.p1-9.
Abstract
The aim of this investigation was to formulate, characterize and evaluate etoricoxib (ET) loaded polymeric nanoparticles for topical delivery. For nanoprecipitation method, ethyl cellulose (EC) was used as polymers. All the formulations were prepared by varying the drug and polymer concentrations. The obtained nanoparticles were evaluated for yield, drug content, entrapment efficiency, loading capacity and in-vitro drug release. Comparative study was performed among the formulations of ethyl cellulose. For the formulation of the gel, carbopol 934 was used as a gelling base. By comparison, F3 formulation of ethyl cellulose was found to be the best with the highest entrapment efficiency of 79.1%, the smallest mean particle diameter (538 nm), a higher stability (-43.8 mV) and the ability to control the release for 12 h with 87.1% drug release. F3 formulation was incorporated into gel F3G. Based on the results, it could be concluded that F3G formulation of etoricoxib topical gel prepared with ethyl cellulose was found to be more efficient with the highest spreadability of 41.22 g.cm/sec and was able to sustain the drug release for about 12 h with a cumulative release of 79.1%.
Keywords: Polymeric nanoparticles; Etoricoxib; Nanoprecipitation; Zeta potential; Gel
Introduction
The present conventional drug delivery systems often has side effects and complications due to their wide distribution throughout the body fluids. The localization of drug action in the injured tissue is a promising way to solve this problem. The object of drug targeting is to achieve a desired pharmacological response at a selected site without undesirable interactions at other sites. At present, drug targeting is achieved with one of two approaches. The first approach involves chemical modification of the parent compound to a derivative which is activated only at the target site. The second approach utilizes carriers such as liposomes, microspheres, nanoparticles, antibiotics, cellular carriers (erythrocytes and lymphocytes) and macromolecules to direct the drug at its site of action [1]. The field of nanotechnology is one of the most active research areas in modern materials science. Nanoparticles exhibit new or improved properties based on specific characteristics such as size, distribution and morphology. There have been impressive developments in the field of nanotechnology in the recent past years, with numerous methodologies developed to synthesize nanoparticles of particular shape and size depending on specific requirements. New applications of nanoparticles and nanomaterials are increasing rapidly [2]. Nanotechnology can be termed as the synthesis, characterization, exploration and application of nano-sized (1-1000 nm) materials for the development of science. It deals with the materials whose structures exhibit significantly novel and improved physical, chemical and biological properties, phenomena and functionality due to their nano-scaled size. Because of their size, nanoparticles have a larger surface area than macro-sized materials. Nanoparticles, because of their small size, have distinct properties compared to the bulk form of the same material, thus offering many new developments in the fields of biosensors, biomedicine and bio nanotechnology. Nanotechnology is also being utilized in medicine for diagnosis, therapeutic drug delivery and the development of treatments for many diseases and disorders. Nanotechnology is an enormously powerful technology, which holds a huge promise for the design and development of many types of novel products with its potential medical applications on early disease detection, treatment, and prevention [3]. Etoricoxib (ET) is a potent newer class of cox-2 inhibitor [4, 5]. It is a novel orally active agent that selectively inhibits isoform 2 of the enzyme cyclooxygenase-2 (cox-2). It is available as a tablet and emulgel, which reduces the generation of prostaglandins from arachidonic acid. It is a biopharmaceutical classification system (BCS) class-II drug and is used in the treatment of rheumatoid arthritis, osteoarthritis, acute gout, chronic musculoskeletal pain (including chronic low back pain), postoperative dental pain and primary dysmenorrhoea. However, it has severe cardiovascular, respiratory, nervous system and hepatic side effects when taken orally. In order to avoid the adverse effects of this drug, there is a need to develop site specific drug delivery carriers. Hence, a site specific nano gel is needed, which also further enhances the efficiency of therapy with the usage of topical application by providing a sustained release and avoiding the exposure of vital internal organs to the serious side effects thereby improving the patient compliance [6, 7].
Experimental
Materials
ET was purchased from Hetero Chemicals Pvt. Ltd. Hyderabad. Ethyl cellulose (EC) was purchased from SD Fine Chemicals. Polyvinyl alcohol was purchased from SD Fine Chemicals. Ehanol, acetone and sodium hydroxide were purchased from SD Fine Chemicals.
Methods
For the preparation of ET nanoparticles, nanoprecipitation technique was adapted. Drug and polymer were dissolved in acetone and sonicated for 10-15 min. The drug-polymer solution was added drop by drop into 0.6% PVA solution under continuous mechanical stirring at 700 rpm. Spontaneous precipitate formation can be observed. After 4 h of continuous stirring, the solvent from the resultant precipitate was removed by rotary evaporation. Free flowing amorphous nanoparticles were obtained [8, 9]. Five formulations were prepared by varying the concentration of polymer and drug for the selected polymer. The method was same for all the formulations [10, 11]. The obtained nanoparticles by the above techniques were characterized for (1) drug-polymer interaction; (2) surface morphology studies using scanning electron microscopy (SEM); (3) particle size distribution; and (4) zeta potential. The obtained nanoparticles by the above technique were evaluated for (1) drug content; (2) entrapment efficiency; (3) drug loading capacity; and (4) in-vitro drug release.
Table 1 List of formulations of ethyl cellulose
|
Formulations |
Drug: polymer ratio |
|
F1 |
1:1 |
|
F2 |
1:1.5 |
|
F3 |
1:2 |
|
F4 |
1.5:1 |
|
F5 |
2:1 |
Table 2 Optimized parameters for the preparation of etoricoxib-ethyl cellulose (ET-EC) nanoparticles
|
Formulation |
Optimized parameters |
|
Drug : polymer ratio = 1:1
|
Organic: aqueous phase ratio = 1:2 Concentration of stabilizer poly(vinyl alcohol) (PVA) %W/V = 0.6 Stirring speed = 700 rpm Stirring time = 4 h |
Surface morphology studies using SEM
Surface morphology was determined for all five formulations using SEM (S-3700N, Hitachi, Japan) [12, 13].
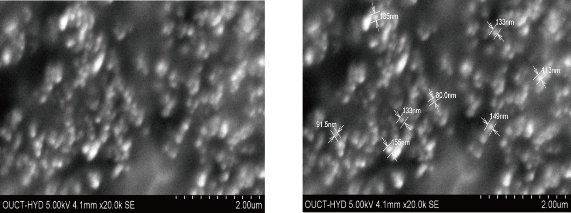
Fig. 1 SEM images of F3 formulation of etoricoxib (ET) loaded ethyl cellulose (EC) nanoparticles.
Particle size distribution
Mean particle size and zeta potential of the nanoparticles were determined by photon correlation spectroscopy (PCS) with a Malvern Zetasizer Nano-ZS (Malvern Instruments, Malvern, UK). The prepared nanoparticles were dispersed in deionised water and sonicated for 30 min. The resultant dispersion was analysed for particle size distribution and zeta potential values. All five formulations were within nano range [14, 15]. The mean particle diameter of F1, F2, F3, F4 and F5 formulations was found to be 501, 530, 539, 440 and 398.4 nm respectively.
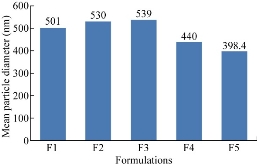
Fig. 2 Comparison of mean particle diameter of five formulations of ET-EC nanoparticles.
Zeta potential
From the results all the formulations were found to be stable. The zeta potential value of F1, F2, F3, F4 and F5 formulations was found to be 27.1, 30.4, 43.8, 23.9 and 22.4 mV respectively.
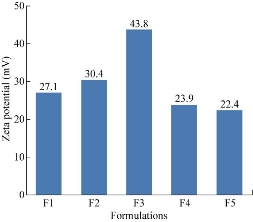
Fig. 3 Comparison of zeta potential values of five formulations of ET-EC nanoparticles.
Results and Discussion
Evaluation of nanoparticles
Product yield
The product yields of the five prepared formulations were evaluated [16]. The product yield of F1, F2, F3, F4 and F5 was found to be 94%, 95.6%, 98.6%, 96% and 95% respectively. Out of the five formulations, the highest product yield was observed for F2 formulation.
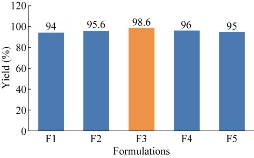
Fig. 4 Comparison of product yield among the five formulations of ET-EC nanoparticles
Drug content
The prepared five formulations were evaluated for drug content. A known amount of drug loaded nanoparticles were weighed, then grinded to fine powder and dissolved in a solvent in which the drug was completely soluble i.e. methanol. It was subjected to stirring at 700 rpm for 3 h. The amount of drug in the supernatent was determined by UV-spectrophotometric method. Three determinations of the drug content from the same batch for each ratio were performed. The results were subjected to statistical analysis to test whether the drug content was uniformly distributed in the nanoparticles or not [17, 18]. Drug content of F1, F2, F3, F4 and F5 formulations was found to be 98.1%, 96.4%, 97%, 98% and 95.8% respectively. Out of the five formulations, the highest drug content was observed for F1 formulation.
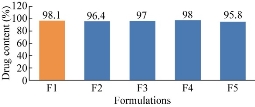
Fig. 5 Comparison of drug content among the five formulations of ET-EC nanoparticles.
Encapsulation efficiency
All the five formulations were evaluated for drug entrapment efficiency using cooling ultracentrifuge (Eltek, Mumbai). Entrapment efficiency was conducted by taking prepared particles in equivalent quantity of pH 7.4 phosphate buffer. The nanoparticles suspension was ultracentrifuged at 17240 rpm and temperature of -4 oC for 40 min. The entrapment efficiency could be expressed as follows [19, 20],
![]()
The percentages of drug entrapment efficiency of F1, F2, F3, F4 and F5 formulation were found to be 61.3%, 70.8%, 79.3%, 52.8% and 45.9% respectively. With the increase in drug concentration, the percentage of drug entrapment efficiency increased. The highest percentage of entrapment efficiency was observed for F3 formulation which could be attributed to its higher polymer concentration.
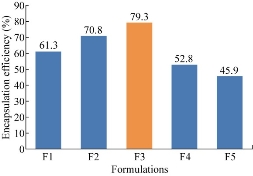
Fig. 6 Comparison of drug entrapment efficiency among the five formulations of ET-EC nanoparticles.
Drug loading capacity
The drug loading capacities were evaluated for the five prepared formulations, according to the following:
![]()
Percentages of drug loading capacity of F1, F2, F3, F4 and F5 were found to be 31.9%, 28%, 25.8%, 34% and 40% respectively. With the increase in drug concentration, the percentage of drug loading capacity was found to increase. It was found that F5 formulation was showing the highest percentage of drug loading capacity.
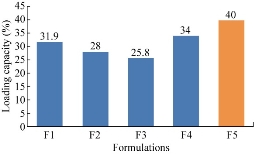
Fig. 7 Comparison of drug loading capacity among the five formulations of ET-EC nanoparticles.
In-vitro drug release
All the five formulations were evaluated for in-vitro drug release by using an orbitary shaker (Orchid Scientifics, Nashik) [21]. In-vitro drug release studies were conducted by using an orbitary shaker in pH 7.4 buffer at a temperature of 37 (+/-) 0.5 ℃ and a rotation speed of 100 rpm. Samples were withdrawn at regular time intervals and replaced with equal quantity of buffer solution. Then the withdrawn samples were centrifuged at 3000 rpm for 15 min, after which the clear supernatant was collected. The drug concentration in the supernatant was observed under UV-spectrophotometer at a wavelength of 235 nm. In-vitro drug release studies were conducted for a time period of 12 h. The percentages of cumulative drug release of F1, F2, F3, F4 and F5 formulations were found to be 94.8%, 92.5%, 87.1%, 96% and 97.8% respectively at the end of 7 h, 12 h, 12 h, 6 h and 5 h respectively. F3 formulation was showing the best sustained release compared to other formulations, which could be attributed to its higher polymer concentration. With the increase in polymer concentration, the sustained release profile of the formulation was found to increase as well. This was because the increase in polymer concentration reduced the diffusivity of solvent through the formulation and thus resulted in decreased drug release rate. In-vitro drug release data of the best formulation F3 was fitted in zero order plot, first order plot, Higuchi plot and Korsmeyer-Peppas plot to reveal the drug release order and mechanism of drug release. It was observed that the optimum formulation F3 followed first order release with non-fickian diffusion mechanism.
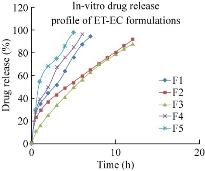
Fig. 8 Comparison of in-vitro drug release data among the five formulations of ET-EC nanoparticles.
Table 3 In-vitro release kinetic data of F3 formulation
|
Time (h) |
Cumulative % drug release |
T ½ |
Log T |
||
|
0.5 |
11.8 |
1.94 |
0.707 |
-0.30 |
1.07 |
|
1 |
15.5 |
1.92 |
1 |
0 |
1.19 |
|
2 |
24.9 |
1.87 |
1.414 |
0.30 |
1.39 |
|
3 |
34.2 |
1.81 |
1.732 |
0.477 |
1.53 |
|
4 |
41.6 |
1.76 |
2 |
0.602 |
1.61 |
|
5 |
49.8 |
1.7 |
2.236 |
0.698 |
1.69 |
|
6 |
57.2 |
1.63 |
2.449 |
0.778 |
1.75 |
|
7 |
63.2 |
1.56 |
2.645 |
0.845 |
1.8 |
|
8 |
70.2 |
1.47 |
2.828 |
0.903 |
1.84 |
|
9 |
76.4 |
1.37 |
3 |
0.954 |
1.88 |
|
10 |
79.1 |
1.322 |
3.162 |
1 |
1.89 |
|
11 |
84.2 |
1.2 |
3.316 |
1.041 |
1.92 |
|
12 |
87.1 |
1.11 |
3.464 |
1.079 |
1.94 |
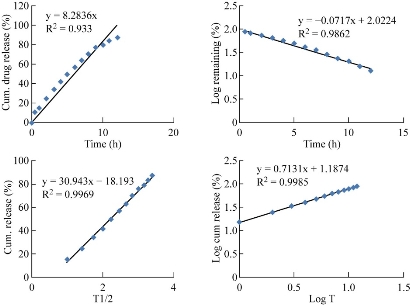
Fig. 9 Kinetic plots of F3 formulation.
Table 4 Parameters determined from the in-vitro drug release kinetic plots
|
Formulation |
Zero order plot (R2) |
First order plot (R2) |
Higuchi plot (R2) |
Peppas plot (N) |
|
F3 |
0.933 |
0.986 |
0.996 |
0.713 |
Evaluation of nanoparticle-loaded gel
Preparation
Step 1: Required quantity of polymer (carbopol) was weighed and was sprinkled slowly on the surface of purified water under continuous mechanical stirring at 600 rpm to get homogenous dispersion. Step 2: With continuous stirring, triethanolamine was added to neutralize the gel. Then the appropriate quantity of propylene glycol was added to the gel which behaved as the penetration enhancer followed by addition of ET / ET nanoparticles. Step 3: Finally, methyl paraben and propyl paraben were added to the gel with continuous stirring till it got dispersed in gel completely.
Table 5 List of different gel formulations
|
Ingredients |
Plain ET gel (PG) |
F3G (ET : EC = 1:2) |
|
Pure etoricoxib (ET) |
1% w/v |
- |
|
ET nanoparticles |
- |
1% w/v |
|
Carbopol 934 |
1 g |
1 g |
|
Triethanolamine |
q.s |
q.s |
|
Propylene glycol |
10 mL |
10 mL |
|
Methyl paraben 0.5% |
0.2 mL |
0.2 mL |
|
Propyl paraben 0.2% |
0.1 mL |
0.1 mL |
|
Distilled water |
Up to 100 mL |
Up to 100 mL |
Clarity
Plain ET gel (PG) and nanobased gel F3G were prepared by simple dispersion technique and evaluated for clarity visually. It was observed that all the formulations were clear.
Table 6 Clarity results of PG and F3G formulations
|
Formulations |
Clarity |
|
PG |
+++ |
|
F3G |
++ |
Measurement of pH
The formulated PG and F3G were evaluated for pH value. The pH of PG and F3G were found to be 6.8 and 6.9 respectively, as calculated in triplicate.
Table 7 pH evaluation of PG and F3G formulations.
|
Formulations |
pH |
|
PG |
6.8 |
|
F3G |
6.9 |
Homogeneity
All the gel formulations were found to be homogenous and free of aggregates.
Grittiness
All the formulations were found to fulfil the requirement of freedom from particular matter and from grittiness as desired for any topical preparation .
Drug content
The percent drug content of PG and F3G formulations were evaluated. The drug content of PG and F3G formulations was found to be 94.2% and 95.3% respectively.
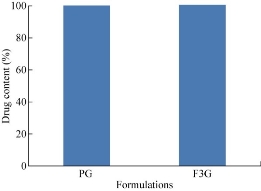
Fig. 10 Comparison of drug content of PG and F3G formulations.
Spreadability
The formulated PG and F3G were evaluated for spreadability. F3G formulation was found to have the highest spreadability of 41.22 g.cm/sec.
Table 8 Spreadability results of PG and F3G formulations
|
Formulations |
Spreadability |
|
PG |
23.53 g.cm/sec |
|
F3G |
41.22 g.cm/sec |
In-vitro diffusion studies
All the five formulations were evaluated for in-vitro diffusion release by using Franz diffusion cell for a period of 12 h. The cumulative percent drug release of PG and F3G formulations were found to be 97.8% and 79.1% respectively at the end of 5 h and 12 h respectively. F3G formulation was showing better sustained release compared to the other formulations, which could be attributed to the higher polymer concentration in nanoparticles and greater entrapment efficiency. With the increase in polymer concentration, the sustained release profile of the formulation was found to be increasing. This was because increase in polymer concentration decreased the diffusivity of solvent through the formulation, resulting in decreased drug release rate. In-vitro drug release data of the best formulation F3G was fitted in zero order plot, first order plot, Higuchi plot and Korsmeyer-Peppas plot to reveal the drug release order and the mechanism of drug release. From the plots, it was observed that the drug release followed first order kinetics with non-fickian diffusion mechanism.
Table 9 In-vitro release kinetic data of F3G formulation
|
Time (h) |
Cumulative % drug release |
Log % remaining |
T ½ |
Log T |
Log % cumulative drug release |
|
0.5 |
9 |
1.95 |
0.707 |
-0.30 |
0.95 |
|
1 |
14.5 |
1.93 |
1 |
0 |
1.16 |
|
2 |
22.6 |
1.88 |
1.414 |
0.30 |
1.35 |
|
3 |
31.3 |
1.83 |
1.732 |
0.477 |
1.49 |
|
4 |
39.8 |
1.77 |
2 |
0.602 |
1.59 |
|
5 |
45 |
1.74 |
2.236 |
0.698 |
1.65 |
|
6 |
55 |
1.65 |
2.449 |
0.778 |
1.74 |
|
7 |
59.8 |
1.6 |
2.645 |
0.845 |
1.77 |
|
8 |
64 |
1.5 |
2.828 |
0.903 |
1.8 |
|
9 |
68.9 |
1.49 |
3 |
0.954 |
1.83 |
|
10 |
71.4 |
1.47 |
3.162 |
1 |
1.85 |
|
11 |
74.2 |
1.41 |
3.316 |
1.041 |
1.87 |
|
12 |
79 |
1.32 |
3.464 |
1.079 |
1.89 |
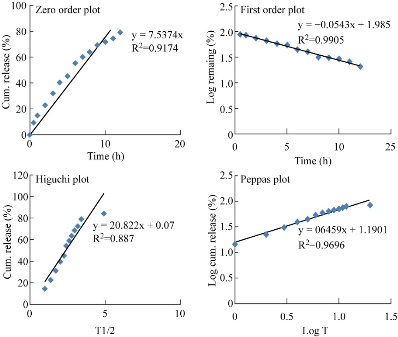
Fig. 11 Kinetic plots of F3G formulation.
Discussion
ET nanoparticles were prepared by nanoprecipitation technique using EC and Eudragit®S100 as polymers. For the preparation of ET loaded EC nanoparticles by nanoprecipitation, the process parameters such as organic to aqueous phase ratio, stabilizer concentration, stirring speed and stirring time were optimized. Five formulations were prepared by varying drug-polymer concentration. Out of the five formulations, F3 formulation was found to be the best formulation with drug content of 97%, entrapment efficiency of 79.1%, loading capacity of 40%, mean particle diameter of 539 nm, zeta potential value of -43.8 mV and in-vitro drug release of 87.1% sustained up to 12 h. The best formulation of EC, F3 was selected for the incorporation into 1% carbopol gel base by simple dispersion method. The formulated PG and the F3G were evaluated for clarity, pH, drug content, spreadability, viscosity and in-vitro diffusion. By comparison, it was found that F3G was the best formulation with optimum pH of 6.9, percent drug content of 95.3, spreadability of 41.22 g.cm/sec and was able to sustain the drug release for about 12 h with cumulative percent release of 79.1. ET nanobased topical gel was successfully formulated using carbopol as a gel base. From the results, it could be concluded that F3G was more advantageous compared to conventional PG form.
Conclusions
Using EC as the polymer, ET nanoparticles were prepared by nanoprecipitation. Five optimized formulations were prepared by varying drug to polymer ratio. Out of the five formulations, F3 formulation was found to be the best formulation with drug content of 97%, entrapment efficiency of 79.3%, loading capacity of 25.8%, mean particle diameter of 539 nm, and zeta potential value of -42.8 mV. FTIR spectrum revealed no drug-polymer interaction, and in-vitro drug release data showed 87.1% of drug release sustained up to 12 h. The F3 formulation was incorporated into a gel and was compared with PG. The nano gel was showing better release profile and drug content when compared with that of PG. Nano based ET loaded gel was successfully prepared for the treatment of rheumatoid arthritis.
Conflict of Interests
The authors declare that no competing interest exists.
References
Copyright© Abbaraju Krishna Sailaja, Naheed Begum. This is an open-access article distributed under the terms of the Creative Commons Attribution License, which permits unrestricted use, distribution, and reproduction in any medium, provided the original author and source are credited.

|
Nano Biomedicine and Engineering. Copyright © Shanghai Jiao Tong University Press |
 |