Research Article
GO-Fe3O4 Nanoparticle Composite for Selective Targeting of Cancer Cells
Venkatesha Narayanaswamy 1*, Yasrib Qurishi 2, Chandan Srivastava 1
1 Department of Materials Engineering, Indian Institute of Science, Bangalore, India.
2 Department of Molecular Reproduction, Development and Genetics, Indian Institute of Science, Bangalore, India.
* Corresponding author. E-mail: venkateshnrn@gmail.com
Received: Mar. 6, 2017; Accepted: Mar. 30, 2017; Published: Mar. 31, 2017
Citation: Venkatesha Narayanaswamy, Yasrib Qurishi, and Chandan Srivastava, GO-Fe3O4 Nanoparticle Composite for Selective Targeting of Cancer Cells. Nano Biomed. Eng., 2017, 9(1): 96-102.
DOI: 10.5101/nbe.v9i1.p96-102.
Abstract
Graphene oxide (GO) based nanocomposites have attracted lot of attention in the biomedical field, especially for the diagnosis and treatment of tumors. Using invitro studies, recent reports have illustrated the ability of graphene oxide for selective killing of several cancer cell lines. Coupling of the anticancer property of graphene oxide with magnetic nanoparticles makes the graphene oxide-nanoparticle composite a potential material for diagnosis and treatment of cancer. In this work, GO-Fe3O4 nanoparticle composite was synthesized by the co-precipitation method. The GO-Fe3O4 nanoparticle composite was thoroughly analyzed for their potential towards killing of cancer cell lines by various assays like MTT, cell cycle analysis by flow cytometry, flow cytometric analysis of apoptosis and necrosis, apoptotic characterization of HL-60 cells using fluorescence microscopy, and flow cytometric measurement of intracellular peroxides (ROS). All these biological end-points indicated cell death by apoptosis. Here, we report that GO-Fe3O4 composites interact with HeLa and cause dose dependent cytotoxicity which robustly induced cell cycle arrest, annexin V–FITC staining and reactive oxygen species generation.
Keywords: Graphene oxide; Anticancer; Apoptosis; MTT; Cytometry
Introduction
Graphene oxide-nanoparticles composites are potential materials for efficient diagnosis and treatment of cancer [1, 2, 3, 4]. It is well known that graphene oxide can be functionalized by several drugs [5]; therefore, graphene oxide-nanoparticle composite materials loaded with specific drugs can be used both for imaging and curing pathologies by local drug delivery [6]. Lingyan et al. have designed aptamers-gold nanoparticle hybridized graphene oxide (Apt-AuNP-GO) which can be used for near-infrared (NIR) light-activatable photo thermal therapy [7]. Self-assembled Apt-AuNP-GO nanocomposite can be used to selectively target MUC1-positive human breast cancer cells (MCF-7) due to the interaction of MUC1-binding-aptamer and the MUC1 (type I Trans membrane mucin glycoprotein) on cell membrane [8]. Additionally, this composite also exhibits high light-to-heat conversion capability for photo absorption of NIR light and it is effective at an ultra-low concentration without damaging healthy cells. The composite possesses specific targeting capability, excellent biocompatibility and tumor destruction, which makes it a potential agent for cancer treatment in NIR ranging photo thermal therapy. Some reports have also illustrated that graphene oxide has the ability of killing cancer cells. This is remarkable as it opens up a lot of avenues for exploring the utility of graphene oxide for cancer therapy. Marco et. al. have reported the effectiveness of graphene oxide alone as selective target of cancer stem cells [9]. They have employed tumor sphere assay which measures the clonal expansion of single cancer stem cells under independent conditions. Through this assays they have shown that graphene oxide can inhibit tumor-sphere formation in multiple cell lines like breast, ovarian, prostate, lung and pancreatic. They have also shown that graphene oxide is ineffective in killing bulk cancer cells. Thus graphene oxide can be used as an effective non-toxic therapeutic agent for killing cancer stem cells through differentiation based nanotherapy. In one of our earlier studies, we have shown that arrangement of ferrite nanoparticles on the graphene oxide sheet can affect the contrast enhancing ability in MRI [10].. We have also shown that the cytotoxicity behavior of various cell lines differs with respect to the arrangement of nanoparticles and interlayer distance between the graphene oxide layers. The objective of the present study is to evaluate the cytotoxicity and identify the underlying mechanisms of cytotoxicity of GO-Fe3O4 nanoparticle composite, using various human cancer cell lines of varied tissue origins. The HeLa cell line was selected after preliminary screening since it was one of the most sensitive cell lines for GO-Fe3O4 nanoparticle composite. Here, we report that GO-Fe3O4 nanoparticle composite interacted with HeLa and caused dose dependent cytotoxicity which robustly induced cell cycle arrest, annexin V–FITC staining and reactive oxygen species generation. Morphological studies of the effect of GO-Fe3O4 nanoparticle composite revealed loss of surface projections, chromatin condensation and apoptotic body formation.
Experimental
Synthesis of GO-Fe3O4 nanocomposite
Graphene oxide was synthesized by the Hummer’s method [11]. To synthesize GO-Fe3O4 composite, 0.2 g of as-synthesized graphene oxide prepared in the first step was dispersed in 150 mL of distilled water by sonication. An aqueous solution containing 0.140 g of FeCl3 and 0.0855 g of FeCl2.4H2O was then added into the graphene oxide dispersion and kept under constant stirring. After 2 h of stirring, CH3NH2 was drop wise (at an approximate rate of 1 mL per minute) added into the dispersion to precipitate Fe3O4 nanoparticles over the graphene oxide sheet. This reaction was conducted at the room temperature.
Characterization of the GO-Fe3O4 composite
X-ray diffraction (XRD) profiles from as-synthesized samples were obtained by using the X-Pert PAN Analytical machine employing Cukα radiation source. A 300 keV field emission FEI Tecnai F-30 transmission electron microscope (TEM) was used for obtaining TEM bright field images and selected area electron diffraction (SAD) patterns from as-synthesised samples. Samples for the TEM based analysis were prepared by drop-drying a highly dilute dispersion of the as-synthesised sample onto an electron transparent carbon coated Cu grid. Magnetic measurement data from the as-synthesized composites was obtained by using a Lakeshore vibrating sample magnetometer (VSM). The mass of graphene oxide in the GO-Fe3O4 nanoparticle composite was determined by thermal gravimetric analysis (TGA) measurement conducted using the TGA NETZSCN STA 403 PC machine. X-ray photoelectron spectroscopy (XPS) profiles were obtained from the as-synthesized samples using AXIS Ultra DLD (KRATOS ANALYTICAL) instrument.
Assay of cell proliferation by MTT
All cell lines were grown at a seeding density of 8000 cells/ml/well in 96 well microtiter plates and were exposed to known concentrations of GO-Fe3O4 nanoparticle composite for 48 h. Then, 20 µl of MTT solution (5 mg/ml) was added to each well 3 h before the completion of incubation time of 48 h at 37 °C. The plates were centrifuged and the supernatants discarded, while the MTT-formazon crystals were dissolved in 150 ml DMSO. The OD was measured at 570 nm with reference wavelength of 570 nm [12]. Cell growth, as percent viability, was calculated by comparing the absorbance of treated verses untreated cells.
Cell cycle analysis by flow cytometry
Hela cells (1x10⁶ cells/ml) were treated with GO-Fe3O4, at a concentration of 15 µg/ml and incubated for 24 h to investigate the hypo-diploid sub-G0/G1 fraction as a measure of apoptosis [13]. The cells were harvested at 160 g for 5 min and the cell pellets washed with PBS, fixed in cold 70% alcohol overnight at 20 °C, digested with DNase-free RNase (400 mg/ml) and stained with propidium iodide as described earlier. Cells were analyzed immediately on an LSR flow cytometer (Becton Dickinson, USA). The fluorescence intensity of sub-G0/G1 cell fraction represented the apoptotic cell population.
Flow cytometric analysis of apoptosis and necrosis
HeLa cells (1x10⁶ cells/ml) were treated with GO-Fe3O4 for 24 h, respectively, at varied concentrations to understand the extent of apoptosis. Cells were stained with annexinV-FITC antibody and propidium iodide as per instructions of the manufacture (SantaCrutz) [14]. Cells were scanned in FL-1 (FITC) versus FL-2 (PI) channels on BD-LSR flow cytometer, using quadrant statistics for apoptotic and necrotic cell populations.
Apoptotic characterization of HL-60 cells using fluorescence microscopy
For microscopic quantification of apoptotic cells, 1 x 10⁶ cells/ml/well were seeded in 6 well plates and treated with indicated concentrations of GO-Fe3O4 nanoparticle composite. After 18 h incubation, cells were centrifuged at 1200 rpm for 5 min. Suspended pellet was dissolved in PBS. The air dried smears were fixed in methanol at -200 °C, stained with DAPI (1 μg/ml) and kept at 37 °C for 20 min. Again following PBS wash, mounting was done with glycerol: PBS (90 : 10) on cover slip and prepared slides were observed under fluorescence microscope (Olympus) using UV filter at 40 × magnification [15].
Flow cytometric measurement of intracellular peroxides (ROS)
The level of intracellular peroxides was determined by using 2, 7-dichlorofluorescein diacetate. The non-fluorescent compound DCFH-DA had the ability to permeate cells freely where it was de-esterifies to DCFH, which was further oxidized to DCF that remained entrapped inside the cells. Peroxides generated inside the cells interacted with DCFH to give rise to a fluorescent DCF that was analyzed by flow cytometer. Though oxidation of DCFH-DA is relatively specific for the detection of intracellular peroxides, it however, is one of the widely used assays for measuring oxidative stress in cells due to reactive oxygen species. Cells (0.5 × 10⁶ cells/ml/well), after various treatments in 12-well plate were incubated with medium containing DCFH-DA (5 µM; 10 mM stock in 100% ethanol) for 1h. Cells were washed in PBS and centrifuged at 100 g for 5 min and suspended in DPBS. Propidium iodide (5 µg/ml; stock 1 mg/ml PBS) was added to the samples immediately before analysis. The mean fluorescence peak (10,000 events) was analyzed from the gated cell population. The green DCF-fluorescence was analyzed in the FL-1 channel and PI fluorescence was analyzed in the FL-2 channel [16].
Results and Discussions
Characterization of GO-Fe3O4 composite
XRD profile obtained from the GO-Fe3O4 nanoparticle composite is shown in Fig. 1(a). The XRD profiles in Fig. 1(a) reveal diffraction peaks corresponding to Graphene oxide (GO) and Fe3O4 phase [17]. Diffraction peak of GO was observed at 2 position of 9.9˚. A separate plot derived from the XRD profile corresponding to the Fe3O4 phase is shown as inset in Fig. 1(a). Average size of Fe3O4 nanoparticles obtained from the FWHM (full width at half maximum) of the (311) peak and the Scherrer formula was 8.5 nm [18]. Magnetic hysteresis curve obtained from the GO-Fe3O4 nanoparticle composite is shown in Fig. 1(b). Magnetic hysteresis curve was obtained at the room temperature using an applied field that was swept from 0 to 2 tesla. The magnetic hysteresis curve reveal negligible coercivity which indicates that the Fe3O4 nanoparticles in the GO-Fe3O4 nanoparticle composite are superparamagnetic. XPS spectra were obtained from the pure GO and GO-Fe3O4 nanoparticle composite. A part of the full XPS spectrum showing binding energies of sp2 C-O and C-C bonds (C1s spectrum) is shown in Fig. 1(c). In Fig. 1(c) the lower and higher binding energy peaks respectively correspond to sp2 C-C and C-O bonds [19]. The XPS results strongly indicate that during the second synthesis step, GO present in the reaction mixture has attained reduced graphene oxide nature. Representative TEM bright field images and SAD patterns (insert) obtained from the as-synthesized GO-Fe3O4 nanoparticle composite is provided in Fig. 1(d). TEM bright field image clearly reveals nanoparticles embedded in GO sheets. Contrast in the bright field TEM micrographs in Fig. 1(d) is essentially mass thickness contrast where the darkest regions correspond to nanoparticles and the lighter contrast regions show GO sheet. SAD pattern reveals diffraction rings corresponding to different planes in the lattice of Fe3O4 phase confirming that the as-synthesized composite contained Fe3O4 nanoparticles [10].
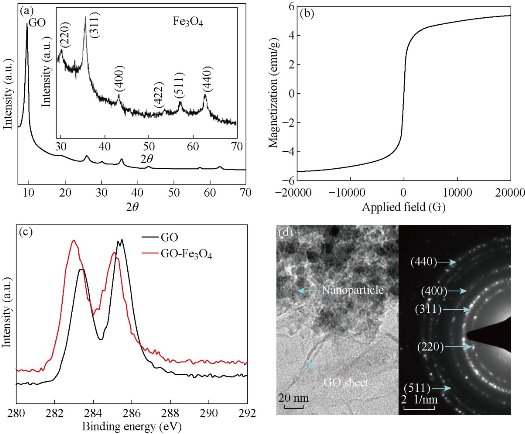
Fig. 1. (a) XRD; (b) M vs. H; (c) XPS; (d) TEM bright field image and SAD pattern of GO-Fe3O4 nanocomposite.
Determination of IC50 values and cell viability
GO-Fe3O4 inhibited cell growth depending upon the cell line used in a dose dependent pattern with varying IC50 values, e.g. IC50 value was of the order of 10.5 μg/ml (HeLa) in the case of cervical cancer compared to breast cancer cell lines in which the IC50 value was of the order of 10 μg/ml. In addition, cytotoxicity assay based on MTT was performed and compared with normal keratinocytes (HaCaT) in which IC50 value was calculated to be beyond 100 μg/ml. The treatment of MCF-7 and HeLa cells treated with GO-Fe3O4 at different concentrations for 24 h depicted concentration dependent inhibition of cell proliferation at very low conc. (Fig. 2) without affecting normal cell line (HaCaT). Thus, for further studies, the mechanistic basis of cell death by GO-Fe3O4 was studied.
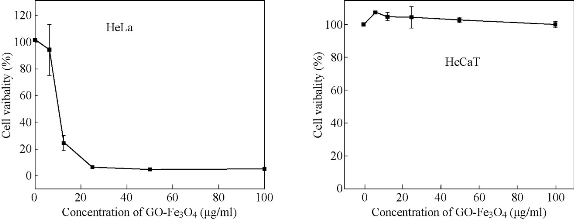
Fig. 2. Cytotoxicity of GO-Fe3O4 nanocomposite with HeLa and HaCaT cell lines.
GO-Fe3O4 increased sub-G0 fraction of cell cycle measured by flow cytometry
HeLa cells exposed to 15 µg/ml of GO-Fe3O4 up to 24 h exhibited continuous increase in sub-G0 fraction which may comprise both apoptotic and debris fraction implying together the extent of cell death (Fig. 3). The damage was more apparent with higher GO-Fe3O4 concentration over the period of study. The sub-G0 fraction increased by far more than 1% in case of control as compared to 17.92% in case of HeLa after 24 h of treatment with GO-Fe3O4.
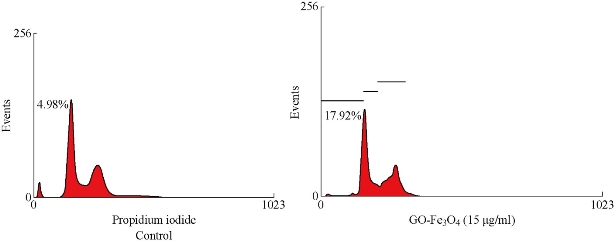
Fig. 3. Cell cycle Assay on HeLa cells.
GO-Fe3O4 analyzed by flow cytometry using Annexin-V binding
Experiments were carried out to evaluate the nature of cell death induced by GO-Fe3O4 in cervical cancer cell lines (HeLa) respectively. The HeLa cells were treated with GO-Fe3O4 at varied concentrations for 24 h and these cells underwent an apoptotic cell death that was determined by Annexin-V binding of phosphatidyl serine of exposed cells by flow cytometry (Fig. 4). Both apoptotic and post-apoptotic cell populations increased with exposure time. In HeLa cells, 71.56% cells were apoptotic as opposed to 9.78% post-apoptotic at 15 µg/ml, while at 20 µg/ml 73.45% of cells were apoptotic compared to 10.74% necrotic after 24 h of treatment with 20 µg/ml of GO-Fe3O4 (Fig. 4). Thus necrotic events appeared to follow apoptosis immediately and such necrotic cells may belong to the population of post-apoptotic necrosis. Apoptosis thus appeared to be the primary mode of cell death induced by GO-Fe3O4.
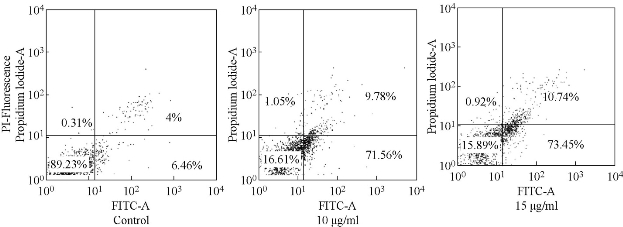
Fig. 4. Annexin/PI apoptosis assay (24 h) in MCF-7 cells.
Hoechst staining of GO-Fe3O4 induced apoptotic body formation in HeLa and HaCaT cells
Nuclei of untreated cells appeared prominently round in shape (Fig. 5). Upon exposure, GO-Fe3O4 caused early condensation of nuclei and simultaneously induced morphological alterations in some of the cells (Fig. 5). The morphological changes were accompanied by increase in number of apoptotic bodies upon prolonged exposure to 15 µg/ml of GO-Fe3O4 in case of HeLa cells (Fig. 5) compared to HaCaT in which intact morphology was observed.
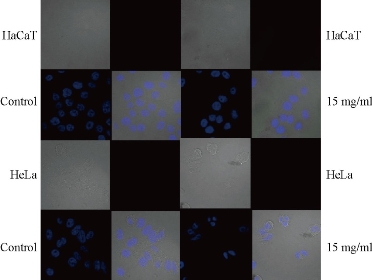
Fig. 5. Internalization of GO-Fe3O4 nanocomposite in HaCaT versus HeLa cell lines.
GO-Fe3O4 mediated intracellular generation of peroxides in HeLa cells
Cells were incubated with GO-Fe3O4 for different concentrations and analyzed by flow cytometry after double staining with DCFH-DA (Fig. 6). Cells were gated from the forward and side scatter plots and analyzed for fluorescence intensity in channels FL1 vs. FL2 and FL1 vs. cell count. However, there was a slight increase in DCF positive cell population with an increase of about 2-log fluorescence intensity over control.
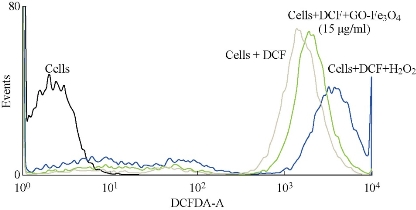
Fig. 6. GO-Fe3O4 mediated intracellular generation of peroxides in HeLa cells.
Conclusions
Graphene oxide composite, showed cytotoxicity in human breast cancer cell lines. A detailed study is conducted to investigate the mechanism of cell death in human cancer cell line. GO-Fe3O4 composite inhibited HeLa cell proliferation with 24 h IC50 of 10 µg/ml, increased sub-G0 cell fraction, produced apoptotic bodies and induced ROS generation. Flow cytometric analysis of annexinV-FITC/PI-stained cells showed time-related increase in apoptosis and post-apoptotic necrosis. All these biological end-points indicated cell death by apoptosis. GO-Fe3O4 produced no cytotoxicity in HaCaT cell culture at the concentrations used. Here, we are reporting the interaction between GO-Fe3O4 composite interact HeLa and caused dose dependent cytotoxicity which robustly induced cell cycle arrest, annexin V–FITC staining and reactive oxygen species generation. Morphological studies of the effect of GO-Fe3O4 revealed loss of surface projections, chromatin condensation and apoptotic body formation.
References
Copyright© 2017 Venkatesha Narayanaswamy, Yasrib Qurishi, and Chandan Srivastava. This is an open-access article distributed under the terms of the Creative Commons Attribution License, which permits unrestricted use, distribution, and reproduction in any medium, provided the original author and source are credited.

|
Nano Biomedicine and Engineering. Copyright © Shanghai Jiao Tong University Press |
 |