Research Article
Formulation of Mefenamic Acid Loaded Ethosomal Gel by Hot and Cold Methods
Regunta Supraja, Abbaraju Krishna Sailaja *
RBVRR Women’s college of pharmacy, Osmania University, Hyderabad, India.
* Corresponding author. E-mail: shailaja1234@rediffmail.com
Received: Feb. 27, 2017; Accepted: Mar. 16, 2017; Published: Mar. 23, 2017.
Citation: Regunta Supraja, Abbaraju Krishna Sailaja, Formulation of Mefenamic Acid Loaded Ethosomal Gel by Hot and Cold Methods. Nano Biomed. Eng., 2017, 9(1): 27-35.
DOI: 10.5101/nbe.v9i1.p27-35.
Abstract
The aim of the present study is the formulation of mefenamic acid ethosomal gel by hot and cold methods. To prepare the mefenamic acid transdermal gel, ethosomes was selected as colloidal carriers. Ethosomes were prepared by cold and hot methods. The obtained ethosomes were characterized with vesicular diameter, zeta potential, drug content, entrapment efficiency and in-vitro diffusion studies. The five formulations of ethosomes prepared by cold and hot methods were compared. Among the 10 formulations of ethosomes, E5 was considered as the best formulation because of its mean vesicular diameter of 854 nm, zeta potential of 20 mV, drug content of 96.3%, entrapment efficiency of 94.4%, sustained drug release for 12 hr, i.e. 94.4. Then the E5 formulations was incorporated into gel. A comparative study was made between the plain gel and the ethosomal gel. The Ethosomal gel was considered the best because of its highest drug content spreadability , pH (6.9) and the sustained drug release profile for 12 hr. By comparison, the cold method shows better results.
Keywords: Mefenamic acid; Ethosomes; Transferosomes; Stability; Vesicular diameter; Entapment efficiency
Introduction
Transdermal drug delivery system can be used as an alternative delivery of drug into the systemic circulation. Transdermal drug delivery offers many advantages as compared to traditional drug delivery. It is a better alternative to achieve constant plasma levels for prolonged periods of time, which additionally could be advantageous because of less frequent dosing regimens [1,2].These systems include the use of physical means, such as iontophoresis, sonophoresis, microneedles, etc., chemical means like penetration enhancers and biochemical means using liposomes, niosomes, transferosomes and ethosomes. They also have been reported to enhance the permeability of drug through the stratum corneum. The vesicles have been well known for their importance in cellular communication and particle transportation for many years. Researchers have understood the properties of the vesicle structure for use in better drug delivery within their cavities, which would tag the vesicle for cell specificity [3,4]. One of the major advances in vesicle research was the finding of a vesicle derivative, known as ethosomes. The ethosomal system is composed of phospholipid, high concentration of alcohol and water. The high concentration of ethanol makes ethosomes unique, because ethanol causes the disturbance of skin lipid bilayer organization. Hence, when incorporated into a vesicle membrane, it enhances the vesicles’ ability to penetrate the stratum corneum [5,6]. Mefenamic acid (MA) is a non-steroidal anti-inflammatory drug (NSAIDS) that exhibits anti-inflammatory and analgesic activities. It is a BCS class-2 drug. It is available in the forms of tablets, capsules and suspension. MA has a wide range of gastrointestinal disorders, such as gastrointestinal bleeding& gastric upset. It has poor solubility over the pH range of 1.2-7.5. The biological half-life of MA is 2-4 hr. MA causes COX-1 and COX-2 inhibition. By inhibiting COX-1 receptors, it causes severe gastric bleeding and peptic ulcers. By inhibiting COX-2 receptors, it causes severe cardiovascular side effects. Because of the short half-life, frequent administration of the drug is required which may lead to missing the dose of the drug and thus under medication. Hence, formulating mefenamic acid loaded ethosomes can minimize the dose, the dosing frequency and the side effects. There is no transdermal formulation of mefenamic acid available to date as per literature review [7,8].
Materials and Methods
Formulation of mefenamic acid loaded ethosomes by cold method
According to this method, the required amount of soya lecithin and drug were taken, a few ml of ethanol was added, and then it was kept for magnetic stirring. During the stirring, small quality of propylene glycol was added; the temperature and the speed were maintained at 30 ᵒC and 700 RPM for 20 min. In another phase, distilled water was heated at 30 ᵒC. This aqueous phase was added to organic phase. This mixture was stirred for another 5 min which led to the formulation of ethosomes. The formulation was stored under refrigeration.
Five formulations were prepared by varying the drug and soya lecithin concentration [11,12] (Table 1).
Table 1 List and composition of formulations prepared by cold method
|
No. |
Formulation code |
Drug: soya lecithin |
Propylene glycol (ml) |
Ethanol (ml) |
|
1 |
E1 |
1:1 |
1 |
2 |
|
2 |
E2 |
1:1.5 |
1 |
2 |
|
3 |
E3 |
1.5:1 |
1 |
2 |
|
4 |
E4 |
1:2 |
1 |
2 |
|
5 |
E5 |
2:1 |
1 |
2 |
Formulation of mefenamic acid loaded ethosomes by hot method
According to this method, phospholipid and mefenamic acid were dispersed in water by heating in a water bath at 40 ⁰C until a colloidal solution was obtained. Ethanol, propylene glycol and drug were mixed in a separate vessel and heated up to 40 ⁰C. Organic phase was added to aqueous phase and stirred for 5 min at 700 rpm on a magnetic stirrer. The vesicle size of ethosomal formulation was decreased to the desired extent using sonication. Finally, the formulation was properly stored at 4 0C. Five formulations were prepared by varying the soya lecithin concentration and percentage volume of ethanol [9,10] (Table 2 & 3).
Table 2 List and composition of formulations prepared by hot method
|
No. |
Formulation code |
Drug (w/v): phospholipid % (w/v) |
Propylene Glycol (ml) |
Ethanol (ml) |
|
6 |
E6 |
1:1 |
1 |
2 |
|
7 |
E7 |
1:1.5 |
1 |
2 |
|
8 |
E8 |
1.5:1 |
1 |
2 |
|
9 |
E9 |
1:2 |
1 |
2 |
|
10 |
E10 |
2:1 |
1 |
2 |
Table 3 Parameters optimized for the preparation of mefenamic acid ethosomes by hot method
|
Optimized parameters |
Formulation variables |
Constant parameters |
|
Stirring speed (rpm) |
300 rpm 500 rpm 700 rpm |
Soya lecithin; Ethanol; Propylene glycol; Drug; Heating temperature |
|
Heating temperature |
40 oC
|
Cholesterol; Soya lecithin; Drug; Rotation speed |
Results and Discussion
Mefenamic acid loaded ethosomes using cold method
Process parameters such as stirring speed and heating temperature were optimized at 500 rpm and 30 0C respectively. By varying the drug ratio of,soya lecithin, five formulations E1, E2, E3, E4 and E5 were prepared. From the results it was found that mean vesicular diameter of all five formulations was in nano-range. They were characterized and evaluated in order to determine the best formulation for the preparation of mefenamic acid loaded ethosomes by cold method [13,14].
Optical Microscopy
Morphology was determined for all the five formulations using optical microscopy (S-3700N, Hitachi, Japan) [15,16]. The photo micrographic pictures of the preparation were obtained from the microscope by using a digital SLR camera (Fig. 1).
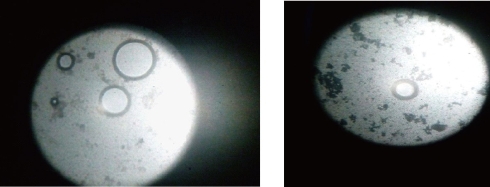
Fig. 1 Photomicrographic images of E5 formulation of mefenamic acid loaded ethosomes prepared by cold method (magnification 10 ×).
Vesicle diameter
The prepared five formulations were characterized for particle size using Zetasizer (Malvern Instruments Ltd) [17,18]. The analysis was performed at a temperature of 25 oC with double distilled water as dispersion medium (Fig. 2). All five formulations were in nano-size range. The mean vesicular diameters of E1, E2, E3, E4 and E5 formulations were found to be 374 ± 2, 362 ± 3, 359 ± 2,472 ± 4 and 480 ± 3 nm respectively. Among all the formulatins E3 formulation was showing minimum vesicular diameter.
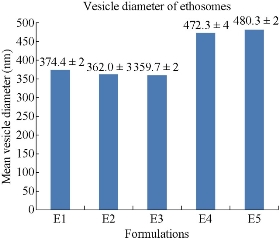
Fig. 2 Comparison of mean vesicular diameters of five formulations of mefenamic acid ethosomes prepared by cold method.
Zeta potential
The prepared five formulations were characterized for zeta potential value in order to know the stability of the formulations. The analysis was performed at a temperature of 25 oC with double distilled water as dispersion medium [19, 20]. From the results all the formulations were found to be stable (Fig. 3). From the results all the formulations were found to be stable. The zeta potential values of E1, E2, E3, E4 and E5 formulations were found to be -13.3 ± 0.5, -17.2 ± 0.4, -11.2 ± 1, -31.3 ± 2 and -20.1 ± 1 mV respectively. Among all formulations E4 formulation was showing highest zeta potential value with greater stability of -31.1 mV.
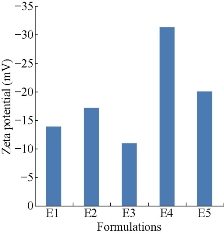
Fig. 3 Comparison of zeta potential values of five formulations of mefenamic acid ethosomes prepared by cold method.
Drug content
The prepared five formulations were evaluated for drug content (Fig. 4). Drug content of E1, E2, E3, E4 and E5 formulations was found to be 58.35 ± 3, 53.50 ± 2, 47.14 ± 4, 64.94 ± 4 and 96.34 ± 5% respectively. E5 formulation containing the 2 : 1 ratio of drug : phospholipid was considered the best formulation because of its highest drug content of 96.34%.
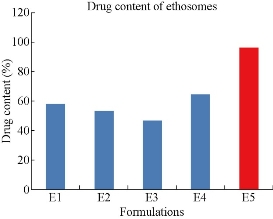
Fig. 4 Comparison of drug content among the five formulations of mefenamic acid loaded ethosomes prepared by cold method.
Entrapment efficiency
All the five formulations were evaluated for drug entrapment efficiency using cooling ultra-centrifuge (Eltek, Mumbai) [21] (Fig. 5). The percentages of drug entrapment efficiency of E1, E2, E3, E4 and E5 formulations were found to be 87.2 ± 3, 84.1 ± 4, 93.38 ± 4, 89.44 ± 3 and 94.4 ± 5% respectively. From the results the highest percentage of entrapment efficiency 94.4% was observed for 2 : 1 ratio of drug to phospholipid, ie. formulation E5. The ethosomes prepared using drug: soya lecithin at 2 : 1 ratio showed higher entrapment efficiency. Further increasing soya lecithin concentration decreased the entrapment efficiency.
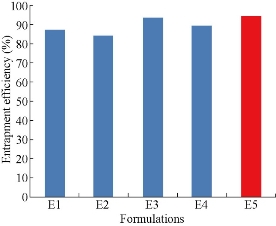
Fig. 5 Comparison of drug entrapment efficiency among five formulations of mefenamic acid loaded ethosomes prepared by cold method.
Comparison of in-vitro drug diffusion study data of mefenamic acid loaded ethosomes
All the five formulations were evaluated for in-vitro drug diffusion studies using Franz diffusion cell. In-vitro drug release studies were conducted for a time period of 12 hr (Fig. 6). From the data it was observed that E5 formulation containing 2 : 1 ratio of drug to soya lecithin formulation showed a sustained release up to 12 hr with drug release of 94.4%. In ethosomal formulations, the experimental studies showed that the rate of drug release depends on the percentage of drug entrapment efficiency. From the five ethosomal formulations E5 showed more sustained drug release than other formulations. Hence, it was considered as the best ethosomal formulation.
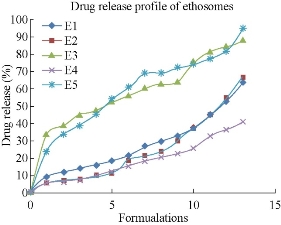
Fig. 6 Comparison of in-vitro drug diffusion studies among the five formulations of mefenamic acid loaded ethosomes prepared by cold method.
Ethosomes prepared by hot method
A general procedure based on the literature was followed for the preparation of mefenamic acid ethosomes. The process variables were optimized to yield mefenamic acid ethosomes with smaller mean particle diameter, good stability and higher entrapment efficiency. By varying the drug : soya lecithin ratio, five formulations E6, E7, E8, E9 and E10 were prepared. From the results it was found that the sizes of all five formulations were in optimum range. They were characterized and evaluated in order to determine the best formulation for the preparation of mefenamic acid loaded ethosomes by hot method.
Optical microscopy
Morphology was determined for all the five formulations using optical microscopy (S-3700N, Hitachi, Japan). The photo micrographic pictures of the preparation were obtained from the microscope by using a digital SLR camera (Fig. 7).
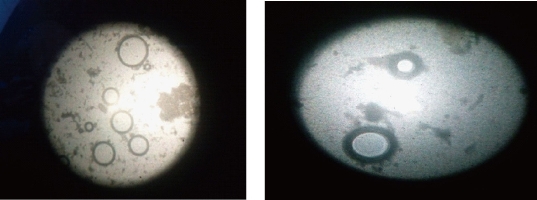
Fig. 7 Photomicrographic images of E6 formulation of mefenamic acid loaded ethosomes prepared by hot method (magnification 10 ×).
Particle size distribution:
The prepared five formulations were characterized for mean vesicular diameter using Zetasizer (Malvern Instruments Ltd). The analysis was performed at a temperature of 25 oC with double distilled water as dispersion medium (Fig. 8). All five formulations were in nano-size range. The mean vesicular diameters of E6, E7, E8, E9 and E10 formulation were found to be 412.9 ± 3, 393.9 ± 4, 706.9 ± 5, 895.2 ± 4 and 373.6 ± 5 nm respectively. Among all formulations E10 was showing minimum vesicular diameter of 373.6 ± 4 nm.
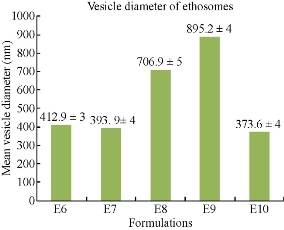
Fig. 8 Comparison of mean vesicular diameters of five formulations of mefenamic acid ethosomes prepared by hot method.
Zeta potential
The prepared five formulations were characterized for zeta-potential value in order to know the stability of the formulations. The analysis was performed at a temperature of 25 oC with double distilled water as dispersion medium. From the results all the formulations were found to be stable (Fig. 9). From the results all the formulations were found to be stable. The zeta potential values of E6, E7, E8, E9 and E10 formulation were found to be -11.4 ± 2, -15.8 ± 3, -29.1 ± 2, -17.6 ± 2 and -18.6 ± 1 mV respectively. Among all the five formulations E8 formulation was showing greater stability than other formulations.
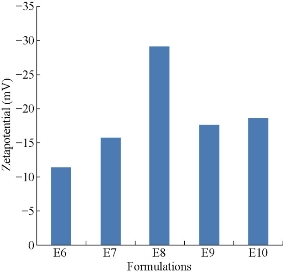
Fig. 9 Comparison of zeta potential values of five formulations of mefenamic acid ethosomes prepared by hot method.
Drug content
The prepared five formulations were evaluated for drug content (Fig. 10). Drug content of E6, E7, E8, E9 and E10 formulations was found to be 83.82 ± 2, 63.71 ± 2, 77.84 ± 3, 73.05 ± 3 and 80.32 ± 4% respectively. Out of five formulations, the highest drug content was observed for 1:1 ratio of drug to phospholipid formulationE6 with 83.2%.
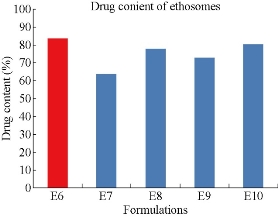
Fig. 10 Comparison of drug content among the five formulations of Mefenamic acid loaded ethosomes prepared by hot method.
Encapsulation efficiency
All the five formulations were evaluated for drug entrapment efficiency using cooling ultra-centrifuge (Eltek, Mumbai) (Fig. 11). The percentage of drug entrapment efficiency of E6, E7, E8, E9 and E10 formulations was found to be 72.85 ± 2, 65.79 ± 2, 70.54 ± 3, 48.03 ± 3 and 51.52 ± 5% respectively. From the results the highest percentage of entrapment efficiency of 72.85% was observed for 1 : 1 ratio of drug : phospholipid formulation, ie. E6. The ethosomes prepared using drug : Soyalecithin at 1 : 1 ratio showed higher entrapment efficiency.
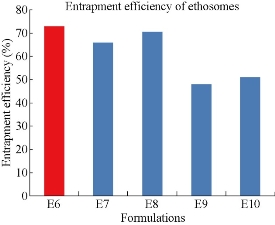
Fig. 11 Comparison of drug entrapment efficiency among five formulations of mefenamic acid loaded ethosomes prepared by hot method.
Comparison of in-vitro drug diffusion study data of mefenamic acid loaded ethosomes.
All the five formulations were evaluated for in-vitro drug diffusion studies using Franz diffusion cell. In-vitro drug release studies were conducted for a time period of 12 hr (Fig. 12). From the data it was observed that E6 of 1 : 1 ratio of drug to soya lecithin formulation showed a sustained release profile of 70.31% for up to 12 hr when compared to other formulations. In ethosomal formulations, the experimental studies showed that the rate of drug release depends on the percentage of drug entrapment efficiency. Among the five ethosomal formulations, E6 showed more sustained drug release than other formulations. Hence, it was optimized as the best ethosomal formulation.
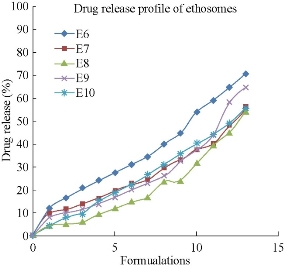
Fig. 12 Comparison of in-vitro drug diffusion studies among the five formulations of mefenamicacid loaded ethosomes prepared by hot method.
Comparison between cold method and hot method
Ethsomes were prepared by cold method and hot method. By comparison, cold method was considered as a preferable method because of its minimum mean vesicular diameter, highest stability, highest drug content, entrapment efficiency and in-vitro drug release.
Kinetic models for optimized formulation
Several plots (zero order plot, first order plot, higuchi plot and peppas plots) were drawn for the optimized formulation in order to know the release kinetics and drug release mechanism (Table 4 & 5). From the results it was concluded that the drug release was following first order kinetics and fitted into korsmeyer equation revealing fickian diffusion mechanism.
Table 4 Kinetic data of E5 ethosomal formulations
|
Time (hr) |
Cumulative drug release (%) |
Drug remaining (%) |
Log drug remaining (%) |
T ½ |
Log T |
Log cumulative drug release (%) |
|
0.5 |
23.88 |
76.12 |
1.881 |
0.707 |
-0.30 |
1.37 |
|
1 |
33.84 |
66.16 |
1.802 |
1 |
0 |
1.529 |
|
2 |
39 |
61 |
1.78 |
1.414 |
0.30 |
1.59 |
|
3 |
43.96 |
56.04 |
1.748 |
1.732 |
0.477 |
1.64 |
|
4 |
50.52 |
49.48 |
1.693 |
2 |
0.602 |
1.703 |
|
5 |
54.32 |
45.68 |
1.659 |
2.236 |
0.698 |
1.734 |
|
6 |
60.44 |
39.56 |
1.597 |
2.449 |
0.778 |
1.781 |
|
7 |
66.56 |
33.56 |
1.524 |
2.645 |
0.845 |
1.82 |
|
8 |
68.72 |
31.28 |
1.495 |
2.828 |
0.903 |
1.83 |
|
9 |
75.16 |
24.84 |
1.395 |
3 |
0.954 |
1.87 |
|
10 |
77.36 |
22.64 |
1.354 |
3.162 |
1 |
1.88 |
|
11 |
84.24 |
15.76 |
1.197 |
3.316 |
1.041 |
1.92 |
|
12 |
94.04 |
5.96 |
0.775 |
3.464 |
1.079 |
1.97 |
Table 5 Kinetic data of E5 formulation
|
Formulation |
Zero order plot (R2) |
First order plot (R2) |
Higuchi plot (R2) |
Peppas plot (n) |
|
FE5 |
0.693 |
0.8532 |
0.9786 |
0.4004 |
Evaluation of plain and ethosomes gel
Clarity
Plain gel (PG) and nanobased gel (E5G,T10G) were prepared by simple dispersion technique and evaluated for clarity visually (Table 6). From the results it was observed that all the formulations were clear.
Table 6 Clarity results of PG,E5G and T10G formulations
|
Formulations |
Clarity |
|
PG |
+++ |
|
E5G |
++ |
Measurement of pH
The formulated plain gel(PG) and nanobased gel (E5G,T10G) were evaluated for pH (Table 7). The pH of PG, E5G and T10G were found to be 6.8, 6.9 and 7 respectively, calculated in triplicate.
Table 7 pH evaluation of PG, FE5 and FT10 formulations
|
Formulations |
pH |
|
PG |
6.8 |
|
E5G |
6.9 |
Homogeneity
All the gel formulations were found to be homogenous and free of aggregates.
Grittiness
All the formulations were found to fulfil the requirement of freedom from particular matter and from grittiness as desired for any topical preparation .
Drug content
The percentage drug content of PG, E5G and T10G formulations were evaluated.The percentage drug content of PG and E5G formulations were found to be 94.2% and 98% respectively.
Spreadability
The formulated plain gel (PG) and nanobased gel (E5G) were evaluated for spreadability (Table 8).
Table 8 Spreadability results of PG and E5G formulations
|
Formulations |
Spreadability |
|
PG |
23.53 g cm/sec |
|
E5G |
33.80 g cm/sec |
In-vitro diffusion studies
Both the formulations were evaluated for in-vitro diffusion release study using Franz diffusion cell for a period of 12 hr. The cumulative percentage drug release of PG and E5G formulations were found to be 97.8% and 79.1% respectively at the end of 5 hr and 12 hr respectively. E5G formulation was showing more sustained release compared to other formulations, which can be attributed to the higher drug content and greater entrapment efficiency.
Conclusions
Mefenamic acid is an NSAID which exhibits anti-pyretic, analgesic and anti-inflammatory activity. The present investigation is the formulation of mefenamic acid transdermal gel based on vesicular drug delivery approaches. Mefenamic acid ethosomes and transferosomes were successfully prepared. Ethosomes were prepared by cold and hot methods. Five formulations of ethosomes were prepared by cold method by varying the drug to phospholipid concentration ratio. And five formulations of ethosomes were prepared by hot method by varying the concentration drug to phospholipid ratio. All the formuations were characterized for vesicle diameter, zeta potential and evaluated for drug content, entrapment efficiency and in-vitro diffusion studies. Out of ten formulations of ethosomes, E5 formulation of drug : phospholipid at 2 : 1 ratio was found to be the best formulation. In ethosomes, process parameters such as drug : soya lecithin ratio, stirring speed and heating temperature were optimized. By comparing all the formulations of ethosomes, E5 formulation was considered the best formulation because of its smaller mean vesicle diameter (359.7 nm) ,greater stability (-20.1 mV), drug content (96.34%), and entrapment efficiency (94.4%); in-vitro drug release data showed 94.04% of drug release sustained up to 12 hr and followed the first order kinetics with non-fickian diffusion mechanism. Using 1% w/w carbopol 934 as a polymer gel base, plain gel (PG) and ethosomes loaded (E5G) gel were prepared by dispersion method. The cumulative percentage drug release of PG, E5G formulations were found to be 97.8% and 79.1% respectively at the end of 5 hr and 12 hr. By comparison, E5G was found to be the best as it was able to sustain the release for about 12 hr with a cumulative percentage release of about 79.1%.
References
Copyright© 2017 Regunta Supraja, Abbaraju Krishna Sailaja. This is an open-access article distributed under the terms of the Creative Commons Attribution License, which permits unrestricted use, distribution, and reproduction in any medium, provided the original author and source are credited.

|
Nano Biomedicine and Engineering. Copyright © Shanghai Jiao Tong University Press |
 |