Research Article
Smartphone-Based Fluorescent Diagnostic System for Immunochromatographic Chip
Yafei Hou 1, Kan Wang 1, 2*, Mengdi Yang 3, Weijian Qin 1, Kun Xiao 1, Wenqiang Yan 1
1 Department of Instrument Science and Engineering, School of Electronic Information and Electrical Engineering, Shanghai Jiao Tong University, Shanghai 200240, China.
2 Shanghai Engineering Research Center for Intelligent diagnosis and treatment instrument, Shanghai 200240, China.
3 Shanghai Sixth People's Hospital, School of Medicine, Shanghai Jiao Tong University, Shanghai, 200011, China.
* Corresponding author. E-mail: wk_xa@163.com
Received: Mar. 16, 2017; Accepted: Mar. 21, 2017; Published: Mar. 21, 2017.
Citation: Yafei Hou, Kan Wang, Mengdi Yang, Weijian Qin, Kun Xiao, and Wenqiang Yan, Smartphone-Based Fluorescent Diagnostic System for Immunochromatographic Chip. Nano Biomed. Eng., 2017, 9(1): 21-26.
DOI: 10.5101/nbe.v9i1.p21-26.
Abstract
In order to achieve fast and quantitative detection of fluorescence immunochromatographic chip, a rapid detection system based on smartphone has been developed. In this system, fluorescent signal from quantum dots (QDs) on lateral flow test strips (LFTSs) can be accurately extracted, and the system also can calculate the concentration of the analyte. The method of extraction and recognition of fluorescence signal intensity can be applied to different fluorescent chip detection systems. Based on the fluorescence tomography chip image, a specific program is used for image acquisition, processing and data handling. The Sobel operator algorithm was used in the software,which improved greatly the ability of distinguishing between the test area and the background boundary information. Extracting the components from the red format of the fluorescent strips,the high-signal intensity and sensitivity were achieved. The simulation results show that the proposed method can be applied to the detection system of fluorescence immunochromatographic chip. The experimental results show that the signal intensity has a good correlation with the concentration of immunoassay, which indicates the detection system can extract the intensity of fluorescence signal of the chip.
Keywords:Smart phone; Fluorescence immunochromatographic chip; Intelligent medical care
Introduction
In recent years, the rapid development of immunochromatographic technology makes it occupy an important position in the Point-Of-Care Test (POCT) industry. POCT is a trend in the development of laboratory medicine, which widely used in food evaluation, environmental monitoring, drug testing, medical testing and other fields [1, 2]. With the development of biotechnology and biosensor technology [3, 4] and biochip technology [5-7], POCT becomes more convenient and fast, which makes it more suitable for family medical care and community hospitals. Fluorescence immunochromatographic chip has the advantages of high sensitivity, strong specificity and fast detection speed [8, 9], which is widely used in POCT, such as detection of alpha fetoprotein [10] and chloramphenicol [11] and so on. The detection equipment for fluorescence immunochromatographic chip can be used to quantitatively detect the marker, which has become an important trend in the present and the future [12]. At present, the detection system is mainly based on table computer processing system or embedded technology. In the previous study, the blood C-reactive protein detection system is based on the embedded technology but its overall system coefficient of variation is high [13]. The scanning filter system realized by the embedded technology has the problem of slow detection speed [14]. So the large size, poor portability and detection speed need to be improved. With the popularity of smartphone, it has also been applied to different areas of research [15]. To develop the rapid quantitative chip detection system based on smartphone has great application prospects. In this study, smartphone-based fluorescent diagnostic system for immunochromatographic chip has been developed. In this system, a new method for image feature extraction and recognition for fluorescent chip is developed, which is used to detect the signal area from the fluorescent chip and extract the signal intensity. Experiments show that the signal area of the fluorescent chip can be accurately identified, the signal strength is accurately extracted. In the fluorescence immunochromatographic detection system, the fluorescence signal is positively correlated with the analyte concentration. It indicates that the fluorescence signal extraction method is accurate, suitable for smartphone based on the fluorescent chip detection system.
Method
The structure and detection principle of the chip
The chip mainly consists of five parts: a sample pad, a conjugate pad, a nitrocellulose membrane (NC membrane), an absorbent pad and a polyvinyl chloride (PVC) backing plate. The structure is shown in Fig. 1. PVC backing plate is used to provide structural support; sample pad is used to drop the sample to be tested; conjugate pad is used to fixed the fluorescent probe, in which the sample and the antibody combined with fluorescent probe are fully reacted; the role of nitrocellulose membrane is to fix antibodies and secondary antibodies, respectively, as the Test Line (T line) and Control Line (C line); the role of the absorbent pad is to provide the power of chromatography, while that can absorb the excess liquid sample and reduce the signal interpretation and detection of the impact. Fluorescence chip is a new type of detection technology combined with immuno-labeling technology and chromatographic technology. By fluorescence coloration the qualitative or quantitative analysis of the analyte can be achieved. As the NC membrane is a microporous structure. Using the capillary action and siphon action of the microporous membrane guide the liquid to flow. While the sample and the antigen or antibody immobilized on the NC membrane react to form an immune complex which stays on the T and C lines of the detection area. By analyzing the fluorescence intensity of the marker the quantitative detection results can be obtained. The entire chromatographic process takes about 5-10 min.
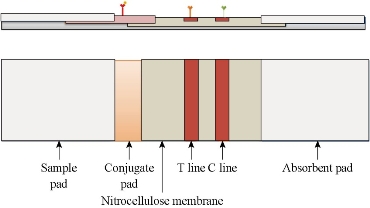
Fig. 1 The structure of the immunochromatographic chip.
The hardware of the detection system
The hardware part of the detection system mainly includes: smartphone, closed shell, ultraviolet (UV) light source and power supply. Smartphone is the mainly part of the detection system, for its camera sensor is used to obtain the chip image and the software which processes the image and shows the detection result runs in it. A black smooth shell and three-dimensional(3D) printed test are used to facilitate the portability of the detection terminal, which provides a closed detection process as well as enhancing the anti-interference capacity. UV light-emitting diodes (LED) are used as light source to emitting 365 nm spectrum. The smartphone supplies for the UV source power through the USB interface, which reduces the volume of the detection system.
Identification of signal area and extraction of signal intensity
As shown in Fig. 1, the signal areas (T Line and C Line) are the rectangle, and the first thing should be done is to identify the coordinate of rectangle and then extracting the signal intensity. The final processing steps are included in the study (Fig. 2, image processing steps). Through the camera sensor of smartphone, the image of fluorescence immunochromatographic chip can be acquired by the detection system. The color image is converted into a grayscale image, which makes it easy to identify the signal area coordinates. And then, the grayscale image is convoluted using the Sobel operator, which enhances the boundary of the signal region and reduces the interference of the background region. After the above step, the research selects the appropriate threshold to convert the image to a binarized image. As we know, the binarized image consists of one and zero, which is helpful to calculate the boundary of the signal area. In the binarized image, the research calculates the sum of each column of pixels, and the sum of each column of pixels forms a discrete sequence. The two peak points of the discrete sequence correspond to the left and right boundary coordinates of the fluorescence signal. At the same time, through calculating the sum of each row of pixels in the binarized image, the sum of each row of pixels also forms a discrete sequence. The four peak points of the discrete sequence correspond to upper and lower boundary line coordinates of the fluorescence signal. After all the above steps, we can accurately obtain the boundary coordinates of the fluorescence signal on the immunochromatographic chip. The next step is to extract the signal strength of the fluorescence signal region. In the three channels (Red, Green and Blue, RGB) of a color fluorescence immunochromatographic chip image, the red channel has a positive correlation with the intensity of the fluorescence signal, but the green and blue channels are not correlated with the intensity of the fluorescence signal. Because the emission wavelength of the fluorescent quantum dots is about 650 nm in this research, which can explain the above phenomenon. As shown in Fig. 3, the fluorescence immunochromatographic chip image is transformed into a binarized image in which the signal boundary can be easily identified. According to the signal boundary, we can read the signal intensity.
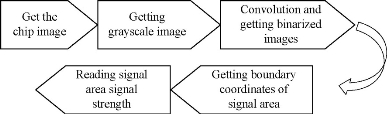
Fig. 2 Image processing steps.
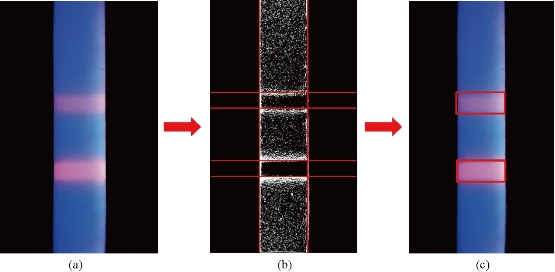
Fig. 3 The chip images in different processing statuses. (a) The origin chip image; (b) The binarized image is marked by the signal boundary red line; (c) The signal areas are been identified through the red rectangles.
Data statistic
All data are presented in this paper as mean ± standard deviation. Statistical differences were evaluated using the t test and considered significant at P < 0.05.
Experiment
Algorithm simulation experiment
Regarding the method of identification of signal area of immunochromatographic chip, we use Matlab to simulate the image process. During the process, we find that the discrete sequence signal has more noise, so using the average method reduce the noise. From the discrete sequence, the boundaries of signal area can be easily identified. As shown in Fig. 4, the boundary position of the fluorescence signal area in immunochromatographic chip image is marked by red star. Through the simulation experiment analysis, this signal area identification method more accurate. Hence, the algorithm is applied to the smart phone software.
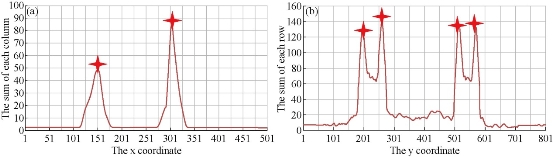
Fig. 4 (a)The left and right boundary of signal area; (b)The upper and lower boundary of the signal area.
Fluorescence immunochromatographic chip detection
Regarding the extraction method of the fluorescent signal intensity,in the research, the red pixel value is selected as the fluorescence signal intensity. The method is also implemented in the smart phone software. During this research, the carcinoembryonic antigen (CEA) is used as analyte and dropped in the fluorescent immunochromatographic chip, which is used to detect the correlation between the fluorescence intensity and the analyte concentration by the detection system based on smartphone. After repeated testing, the linear relationship between the concentration of the analyte and the intensity of the fluorescence signal can be obtained, and the quantitative detection of the analyte can be achieved. In this research, the sample concentrations we selected were: 1, 2.5, 5, 10, 20, 30, 40, 50 ng/mL. In Fig. 5(a), different CEA analyte concentrations correspond to different signal intensities, and with the increase in concentration, the fluorescence signal intensity also gradually increased. In order to avoid the effects of fluorescent immunochromatographic chips. The research adopts the ratio of the red channel pixel value of the T line to that of the C line as the detection signal strength. After repeat experiences, in Fig. 5(b), we can see that the signal intensity and analyte concentration have a high correlation. From Fig. 5(b), the correlation coefficient is 98% and the standard curve line formula is y = 0.0067x + 0.4158 between signal intensity and analyte concentration. According to the standard curve line, we are able to achieve rapid and convenient quantitative detection of analytes through the detection system based on smartphone.
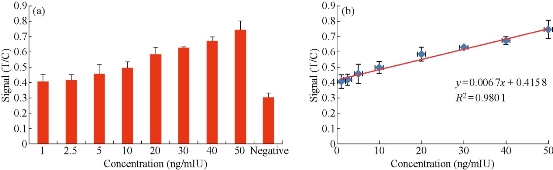
Fig. 5 (a) The signal intensity according different concentration; (b) The standard curve line.
Conclusions
In this study, a smartphone-based fluorescent diagnostic system for immunochromatographic chip was realized. The simple hardware components make the detection system portable and suitable for POCT detection. The methods for identification of signal area from immunochromatographic chip and extraction of signal intensity can not only be used in smart phone detection software but also be suitable for other testing equipment applications. The most important point is that through the smartphone detection system we can calculate the concentration of the analyte such as the CEA antigen. What’s more, the smartphone plays an important role in this detection system. As we know, with rapid development of the internet technology, the smart devices have been used in many fields including medical field [16]. Even the intelligent medical care is a trend of medical development. So this study is of great significance in the field of intelligent medical care in the near future.
Acknowledgments
We are grateful for the financial support by the National Natural Scientific Foundation of China (Grant No. 81571835, 61503246, 81672247 and 81671737), National Key Basic Research Program (973 Project) (No.2015CB931802), the 863 High-Tech Project of China (No. 2014AA020700), Shanghai Science and Technology Fund (No. 13NM1401500 and 15DZ2252000).
Competing Interests
The authors declare no competing financial interests.
References
Copyright© 2017 Yafei Hou, Kan Wang, Mengdi Yang, Weijian Qin, Kun Xiao, and Wenqiang Yan. This is an open-access article distributed under the terms of the Creative Commons Attribution License, which permits unrestricted use, distribution, and reproduction in any medium, provided the original author and source are credited.

|
Nano Biomedicine and Engineering. Copyright © Shanghai Jiao Tong University Press |
 |