Article
Synthesis and Characterisation of Copper II Hydroxide Nano Particles
R Hepzi Pramila Devamani 1* and M Alagar 2
1 Post Graduate Department of physics, V.V.Vanniaperumal College for Women, Virudhunagar.
2 Center for Research and Post Graduate Department of Physics, Ayya Nadar Janaki Ammal College, Sivakasi.
* Corresponding author: RH. P. Devamani (hepzi.justin2001@gmail.com)
Citation: R H. P. Devamani and M Alagar. Synthesis and Characterisation of Copper II Hydroxide Nano Particles. Nano Biomed. Eng. 2013, 5(3), 116-120.
DOI: 10.5101/nbe.v5i3.p116-120.
Abstract
Copper (II) Hydroxide nano particles were synthesized via chemical co-precipitation method from Copper Sulphate and Sodium Hydroxide. Structural and compositional properties were characterized by XRD, SEM, FTIR and UV spectroscopy. XRD confirmed the preferential growth of Copper (II) Hydroxide nano particles that width is 33.42nm. The SEM image shows the synthesized Copper (II) Hydroxide show well crystallized particles with plate-like morphology. The FTIR spectrum is used to study the stretching and bending frequencies of molecular functional groups in the sample. From UV spectrum, the band gap of Copper (II) hydroxide nano particles is found to be 4.5 eV. From AAS studies, it is found that the absorbance is directly proportional to the concentration. The linear fit indicates that Copper (II) Hydroxide nanoparticles have been distributed in proper proportion.
Keywords: XRD, SEM, FTIR, UV, AAS
In recent years, controlled synthesis of mono disperse inorganic nano crystals with different sizes and shapes have been strongly motivated by the requirement to uncover and map their size and shape properties and to achieve their applications [1,2-4]. Nanoparticles, acting as nano scale building blocks can self-assemble into different ordered super structures with a range of practical applications [5-6]. Therefore the development of uniform nano particles has been intensively pursued [7-11]. But the methods usually offer materials with poor optical and physical properties, as the nano crystals can continue to grow slowly at now temperature via coarsening or epitaxial attachment because of the absence of a strong repelling reaction between the particles. For the preparation of nano particles with desired properties it remains a challenge to explore robust pathway and purify principles towards the systematic manipulation of their size and shape. Synthesis of Cu nano structures has been actively researched for many decades because Cu is an important industrial material due to its novel physical and chemical properties. Among all metals used in modern electronic circuits, Cu is the most common one because of its excellent electrical conductivity and low cost. Logically, Cu is expected to be an essential component of nano evices developed in future [6]. Therefore nano scale copper is of particular interest for the applications mentioned above. To date several synthetic approaches– the microwave induced method, the electrochemical synthetic method, the vapor deposition method [9], the sonochemical method [10], the solution-phase synthesis method, and so on [9-20], have been developed for the preparation of nano sized Cu. Cu is one of the most normal conductors in modern technologies and could be used widely in nano device. Many methods have been devoted to the shape controlled synthesis of Cu nano crystals, nano particles, nano wires and nano rods [20-24]. In this paper we have reported the synthesis of Copper (II) Hydroxide nano particles through the chemical co- precipitation method. Copper (II) Hydroxide is used as broad spectrum foliar fungicide on fruits, vegetables and ornamentals. Copper (II) Hydroxide used in the manufacture of rayon, as a source for copper salts, and as a mordant. Copper (II) Hydroxide is used to kill mold in paints. It can be used to color ceramics. It can be used as a catalyst. Copper (II) Hydroxide has been used as an alternative to the bordeaux mixture, a fungicide and nematicide. Copper (II) Hydroxide is also occasionally used as ceramic colorant. Copper (II) Hydroxide has been combined with latex paint, making a product designed to control root growth in potted plants.
Nanoparticles of Copper (II) Hydroxide were prepared by chemical co precipitation method by adding Copper Sulphate and Sodium Hydroxide. Precise amounts of reagents taking into account their purity were weighed and dissolved separately in distilled water into 0.1 M. After obtaining a homogeneous solution, the reagents were mixed using magnetic stirring. The precipitate was separated from the reaction mixture and washed several times with distilled water and ethanol. The wet precipitate was dried and thoroughly ground using agate mortar to obtain the samples in the form of fine powder.
X-ray diffraction (XRD) is an ideal technique for the deter-mination of crystallite size of the powder samples. The basic principle for such a determination involves precise quantification of the broadening of the peaks. XRD line broadening method of particle size estimation was chosen in this investigation for determining the crystallite size of the powder sample. XRD study of the powder samples was carried out at Centre for Electro Chemical Research Institute, Karaikudi. The morphology of the powder samples was studied by the scanning electron microscope (SEM) analysis taken at STIC Cochin. The infra-red spectroscopic (IR) studies of Copper (II) hydroxide nano particles were made by using ‘SHIMADZU’ FTIR 8400S model spectrometer through KBr method. The UV spectrum was taken in the absorbance mode in the wavelength range from 200 to 800 nm.
The XRD patterns of the prepared samples of Copper (II) hydroxide nanoparticles are shown in Fig. 1. XRD studies reveal that the samples are nano sized and crystalline. The fine particle nature of the samples is reflected in the X-ray line broadening. The size of the synthesized Copper (II) hydroxide nanoparticles are calculated using Scherrer equation
D = 0.9λ/β cosθ(1)
where λ represents wavelength of X rays, β represents half width at full maximum and θ is the diffraction angle. 2θ = 35.8468; β = 0.2509 × 3.14 / 180 = 0.00415; D = (0.9 × 0.154) / (0.00415) × cos (17.9234) = 33.419 nm
The average grain size of the particles is found to be 33.42 nm. The peak list in the XRD pattern is given in Table 1 in the complementary data. A good agreement between the Experimental diffraction angle [2θ] and Standard diffraction angle [2θ] of speci- men is confirming standard of the specimen. Eleven peaks at 2θ values of 23.0138, 34.0690, 35.8468, 38.8285, 53.7280, 54.7161, 56.4142, 61.7661, 62.8064, 63.6040 and 68.4804 deg corresponding to (021), (002), (111), (022), (132), (061), (151), (113), (200), (043), and (221) planes of Copper(II) Hydroxide is observed and tabulated in Table 2 in the complementary data and compared with the standard powder diffraction card of Joint Committee on Powder Diffraction Standards (JCPDS), Copper(II) Hydroxide file No. 35-0505. The d-spacing values of experimental is also confirming to the standard values.
The experimental lattice constant ‘a’ is calculated from the most intense peak (111) of the XRD pattern is 2.955 Å. The details of ‘a’ value of all peaks have been produced in Table 3 in the complementary data. The unit cell volume calculated from experimental ‘a’ is 164.78Å3.
The value of d (the interplanar spacing between the atoms) is calculated using Bragg’s Law:
2dsinθ = nλ(2)
![]() (3)
(3)
Wavelength λ = 1.5418 Å for Cu Ka
The expected 2θ positions of all the peaks in the diffraction pattern and the interplanar
Spacing d for each peak is calculated using following formula and the details are shown in table-4 in the complementary data.
![]() (4)
(4)
Bragg’s Law is used to determine the 2θ value: The expected 2θ and d values are close with the experimental 2θ and d values.
The dislocation density is defined as the length of dislo- cation lines per unit volume of the crystal. In materials science, a dislocation is a crystallographic defect, or irregularity, within a crystal structure. The presence of dislocations strongly influences many of the properties of materials. The movement of a dislocation is impeded by other dislocations present in the sample. Thus, a larger dislocation density implies a larger hardness.
The X-ray line profile analysis has been used to determine the dislocation density. The dislocation density (δ) in the sample has been determined using expression.
![]() (5)
(5)
Where δ is dislocation density, β is broadening of diffraction line measured at half of its maximum intensity (in radian), θ is Bragg’s diffraction angle (in degree), a is lattice constant (in nm) and D is particle size (in nm). The dislocation density can also be calculated from
![]() (6)
(6)
Where δ is dislocation density and D is the crystallite size. Results of the dislocation density calculated from both the formulas are given in Table 5 in the complementary data. The number of unit cell is calculated from
![]() (7)
(7)
Where D is the crystallite size and V is the cell volume of the sample [30].It is observed from these tabulated details, and from Fig. 2, 3 and 4, dislocation density is indirectly proportional to particle size and number of unit cell. Dislocation density increases while both particle size and number of unit cell decreases.
A XRD morphology index (MI) is calculated from FWHM of XRD data using the relation
![]() (8)
(8)
Where M.I. is morphology index, FWHMh is highest FWHM value obtained from peaks and FWHMp is value of particular peak’s FWHM for which M.I. is to be calculated. The relation between morphology index and particle size is shown in Table 6 in the complementary data. It is observed that MI has direct relationship with particle size and the results are shown in Fig.5.
Unit cell parameters values calculated from XRD are enumerated in Table 7 in the complementary data.
Scanning electron microscopy was used to analyze the morphology and size of the synthesized Copper (II) Hydroxide nano particles. Fig. 6 shows the SEM images of the Copper (II) Hydroxide nano-particles at 30000 magnifications. The SEM images of Copper (II) Hydroxide nano particles show well crystallized particles with plate-like morphology. In this case the particles sizes are slightly increased and is also observed that the particles are distributed with agglomeration.
4.3 FTIR Studies
The FTIR spectrum of the Copper (II) Hydroxide sample is shown in the Fig. 7. The FTIR spectrum for Copper (II) Hydroxide shows a strong peak at 3569.99 cm−1 corresponding to the free O-H group [27] and the peak at 3487.06 cm−1 is due to the hydrogen bonded O-H group [27]. Another strong and sharp peak with a maximum of 3388.70 cm−1 and 1670.24 cm−1 are due to the hydrogen bonded hydroxyl groups and bending mode of the hydroxyl group of water [29]. The spectrum also shows peak at 1366.58 cm−1 indicating Cu-OH bond [25] and the peak at 881.41 cm−1 indicates Cu-OH vibrations [27,28] and the peak at 420.45 cm−1 is due to the vibrational mode of Cu-O bonds. The peaks at 464.81 cm−1 and 420.45 cm−1 represents the IR active modes for Cu (OH)2 [27].
4.4 UV studies
The band gap of the prepared sample Copper (II) Hydroxide was determined by using UV visible studies. From the UV spectrum the optical band gap of Copper (II) Hydroxide is 4.5 ev. Fig. 8 shows the graph to find the band gap of Copper (II) Hydroxide.
The synthesized Copper (II) Hydroxide nanoparticles have been analyzed by AAS with optical parameter settings Cu wavelength 324.8 nm and Air-C2H2 flame type. The results are given in Table 8 in the comple- mentary data; a linear fit has been got. It is observed from the Fig. 9 that the absorbance is directly proportional to A calibration curve diagram for Concentration of Copper (II) Hydroxide nanoparticles in parts per million (ppm) Vs Absorbance has been drawn and the concentration. The linear fit indicates that Copper (II) Hydroxide nano- particles have been distributed in proper proportion [30].
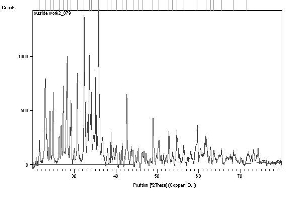
Fig. 1 XRD pattern of Copper II Hydroxide Nano particles.
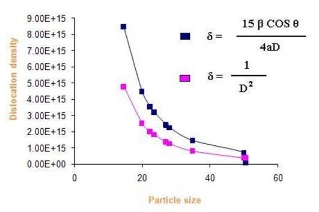
Fig. 2 Dislocation density Vs particle Size
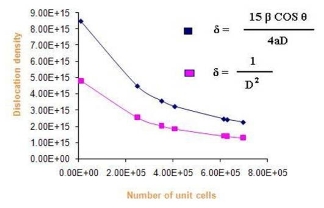
Fig. 3 Dislocation density Vs number of Unit cells.
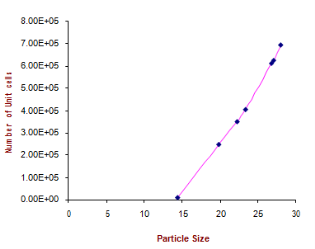
Fig. 4 Number of unit cell Vs particle size.
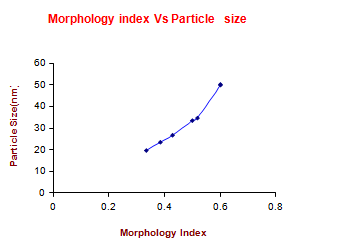
Fig. 5 Morphology Index of Copper (II) Hydroxide Nanoparticles.
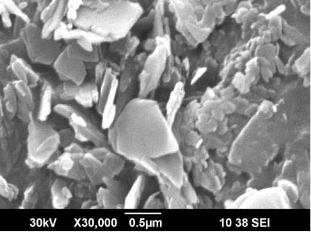
Fig. 6 SEM image at 30000 magnifications.
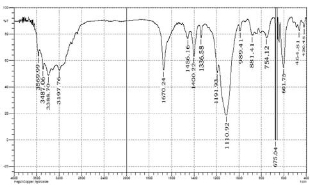
Fig. 7 FTIR spectra of Copper (II) Hydroxide Nano particles.
The Copper (II) Hydroxide nano particles have been prepared by chemical co-precipitation method. XRD analysis suggests that the average particle size is in the nano range (33.42 nm). The SEM picture reveals the well crystallized particles with plate-like morphology. From the FTIR spectrum, the stretching and bending frequencies of the molecular functional groups in the sample are studied. From the UV spectra, the band gap was found. From AAS studies it is found that the absorbance is directly proportional to the concentration. The linear fit indicates that Copper (II) Hydroxide nano- particles have been distributed in proper proportion.
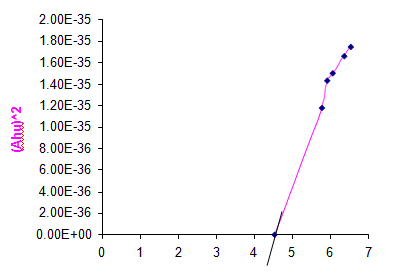
Fig. 8 Graph to find the band gap of Copper (II) Hydroxide Nanoparticles.
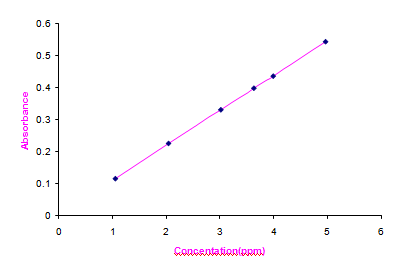
Fig. 9 Concentration Vs Absorbance
References
Copyright:(c) 2013 R H. P. Devamani and M Alagar. This is an open-access article distributed under the terms of the Creative Commons Attribution License, which permits unrestricted use, distribution, and reproduction in any medium, provided the original author and source are credited.

|
Nano Biomedicine and Engineering. Copyright © Shanghai Jiao Tong University Press |
 |