Review
Treatment effect on the adsorption capacity of alumina for removal fluoride
Haixia Wu1,2 Lin Chen1, Guo Gao2, Yan Zhang2, Tingjie Wang1,* and Shouwu Guo2,*
1.Department of Chemical Engineering, Tsinghua University, Beijing 100084, China2.National Key Laboratory of Micro/Nano Fabrication Technology, Key Laboratory for Thin Film and Microfabrication of the Ministry of Education, Research Institute of Micro/Nano Science and Technology, Shanghai Jiao Tong University, Shanghai 200240, China *Corresponding authors: wangtj@mail.tsinghua.edu.cn or swguo@sjtu.edu.cn
Abstract
Acid and base treated alumina particles were studied to assess their capacities for the adsorption of fluoride from aqueous solutions. The surface morphology of untreated alumina was analyzed by SEM and its crystal structure was checked by XRD, and was analyzed by FTIR, SEM and EDS mapping after fluoride adsorption. SEM and EDS were also used to understand the surface change of the alumina after acid and base treatment. Fluoride adsorptions at two different initial fluoride concentrations were investigated. The results show that the fluoride adsorption mainly superficially happened on the alumina particle surface. SEM images show base treatment caused the alumina particle recrystallize, while acid treatment made the alumina particle more amorphous. The adsorption capacity of acid treated alumina was about twice compared with that of alumina, while the capacity of base treated alumina was only about half of that of alumina at the solution pH=7. The high adsorption capacity of acid treated alumina makes it suitable for potential application in fluoride removal from water.
Key Words: adsorption, fluoride, hydroxyl, surface charge
Citation: H Wu, et al. Image processing for the CCD based lateral flow strip detector. Nano Biomed. Eng. 2010, 2(4), p231-235. DOI: 10.5101/nbe.v2i4.p231-235.
1. Introduction
Of all chemical elements, fluorine is the most electronegative and most reactive. Due to its high reactivity, fluorine is not found in nature in its elemental state and exists as fluorides [1], and is harmful to human health because a high concentration of fluoride in drinking water causes dental and skeletal fluorosis [2], etc. Fluoride pollution has been observed not only in various minerals and chemical processes but also in some natural water systems over large areas in Asia, Africa, America, and Europe [3]. The guideline value for fluoride in drinking water are 2.0 mgL-1in the United States [4], 1.5 mgL-1 by the World Health Organization, and 1.0 mgL-1 in China [5]. Adsorption process has been widely used, in which various adsorbents, such as activated alumina, activated carbon, low-cost adsorbents, rare earth oxides, natural products like tree bark, groundnut husk, sawdust, ricehusk, have been utilized, and adsorption is considered one of the most efficient technologies for fluoride removal in drinking water when compared with other technologies like reverse osmosis [6], nanofiltration, electrodialysis [7] and Donnan dialysis [8]. The development of socially acceptable and economical adsorbents to meet local community needs has become a focus of water treatment in the world [9]. As natural materials cannot meet industrial requirements, i.e., low cost and high adsorption capacity, man-made adsorbents have been developed. Rare earth metal hydroxides/oxides are potential adsorbents because of their strong affinity for fluoride [10]. However, rare earth metals are usually expensive, which restricts their use in the treatment of drinking water. Due to the high electro–negativity and small ionic size of the fluoride ion, it has strong affinity towards multivalent metal ions including Al(III), Fe(III) and Zr(IV) [11]. Most adsorbents are synthesized as fine powders or hydroxide floc5. Ultra-fine powder adsorbents cannot be used directly for water treatment because of their low hydraulic conductivity (large pressure drop) [12] in packed bed as well as leaching, and would have to be used in devices that make the separation and recycling of the adsorbent difficult and costly. Alumina was the most widely used adsorbent because it is readily available and inexpensive, which is amphoteric compound and can be dissolved both in acidic or basic solution. This paper studied the effect of acidic/basic treatment on the adsorption capacity for removal fluoride. Studies have been carried out to determine the adsorption capacity of different treated activated alumina. The surface morphology of untreated alumina was analyzed by SEM and its crystal structure was checked by XRD, and was analyzed by FTIR, SEM and EDS mapping after fluoride adsorption. SEM and EDS were also used to understand the surface change of the alumina after acid and base treatment.
2. Materials and Methods
2.1 Reagents
Alumina particles used in this study was procured from, Jiangxi, China. The particles were washed with deionized water to remove dust, and the average diameter of the alumina particles is 1.5 mm. Except alumina particles, all the other chemicals used in this study were of analytical grade.
2.2 Treatment of adsorbent
A 20 g sample of alumina particles were washed by deionized water and dipped in 100Ml deionized water for 6 h, then the particles were filtered and vacuum dried at 80°C for 12 h, which was tagged as WA. A 20 g sample of alumina particles were washed by deionized water and dipped in 100mL 0.1 molL-1HCl solution for 6 h, then the particles were washed until the filtrate almost to neutral and filtered and vacuum dried at 80°C for 12 h, which was tagged as AA. A 20 g sample of activated alumina particles werewashed by deionized water and dipped in 100mL 0.1 molL-1NaOH solution for 6 h, then the particles were washed until the filtrate almost to neutral and filtered and vacuum dried at 80°C for 12 h, which was tagged as BA.
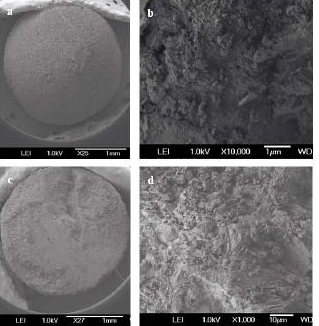
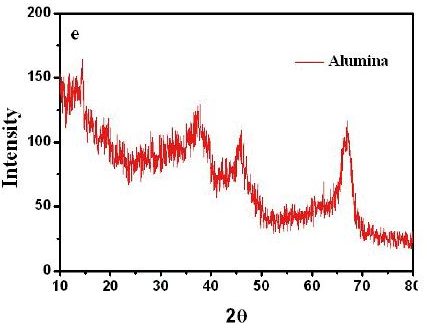
Figure 1 Typical SEM image of untreated alumina particles (a) low magnification and (b) high magnification of the alumina particle surface, (c) low magnification and (d) high magnification of the inner face of the alumina particle, (e) XRD pattern of alumina particles.
2.3 Characterization of adsorbent
The surface morphology of the treated adsorbents were characterized by scanning electron microscopy (SEM, Zeiss ultra 55, Germany) and the appendix EDS. A FTIR spectrometer (Nicolet 5DX, USA) with 2 cm−1 resolution was used for sample analysis. The scans were repeated 200 times in the spectral range from 4000 to 400 cm−1. KBr was used as the mulling agent, and the fraction of the sample in the KBr is about 0.5%. An accessory of“Qwik Handi–Press” was used to press a KBr pellet in diameter of 7 mm. The treated alumina structure was checked by X-ray diffraction (XRD, D/max-RB, Japan), at a beam voltage of 40 kV, using Cu Kα radiation with a monochromator and a small glancing angle fixed at 2θ.
2.4 Fluoride adsorption experiments
A 1000 mgL-1fluoride stock solution was prepared by dissolving 1.1050 g NaF (analytical grade) in 500 ml distilled water. Fluoride bearing solutions were prepared by diluting the stock solution with distilled water. 0.5 g sample was weighed and put into the conical flasks, then 100mL 50 mgL-1fluoride bearing solution was added into the conical flasks. The test solution pH was adjusted to 7.0 with 0.05 mol L-1HClO4or 0.05 mol L-1NaOH, and then the flasks were shaken at 160 rpm and kept at 25°C for 50 h. Then the suspensions were filtered with a 0.45μm membrane filter, the filtrate was analyzed with a fluoride selective electrode connected to an ion meter (IM-40S, TOA, Japan), and the residual fluoride of the suspension can be gained.
3. Results and Discussion
The alumina particles were put on the conductive tape and were examined by scanning electron microscope (SEM). Figure 1a and 1b show the low magnification and high magnification of the alumina particle surface, Figure 1c and 1d show the low magnification and high magnification of the section face of the alumina particle, respectively. It can be obviously seen that the surface and section of untreated alumina were irregular aggregate of powders (Figure 1b and 1d). Alumina has a great capacity for fluoride adsorption, which dependents upon the crystalline structure; therefore, the crystal structure of the alumina was checked by X-ray diffraction. Figure 1e shows that the crystallization degree of treated alumina particles was low, and was pseudo-boehmite, which means that the alumina particles take many hydroxyl groups on its surface. The FTIR spectra of the adsorbent before and after adsorption (at pH=7) are shown in Figure 2. The adsorption bands at 3400 cm–1, 1640 cm–1were assigned to the hydroxyl stretching vibration of water, bending mode of water of the surface hydroxyl group (≡M–OH) [13], respectively. Figure 2 shows that the 3400 cm–1, 1640 cm–1 peaks both present double peaks after fluoride adsorption. It can be deduced that the change of the 3400 cm–1 peak, 1640 cm–1 peak was due to fluoride adsorption on the corresponding hydroxyl site. Since –OH and F– have nearly the same size, they can exchange for each other, and F– can be stably adsorbed. Which also indicates that fluoride adsorption on the alumina particle was on its surface. The fluoride adsorbed alumina particle and its section images are shown in Figure 3a and 3d respectively. The EDS mapping for the surface Al and F are shown in Figure 3b, 3c, and for the section Al and F are shown in Figure 3e and 3f, which was done by secondary electron scattering. Figure 3b, and 3c clearly show that the Al and F elements were uniformly distributed on the particle surface, Figure 3e, and 3f clearly show that the Al element was uniformly distributed, while the concentration of F element decrease from the alumina particle surface to its inner part. In a word, the EDS mappings of Al are almost same as the images (Figure 3a and 3b, 3d and 3e), whereas the EDS mapping of section F is different from its image. Therefore, EDS analysis provides direct evidence that the fluoride was mainly superficially adsorbed on the alumina particle surface. Figure 4a and 4b show the typical images of acid and base treated alumina respectively, and Figure 4c and 4d show their EDS spectra. It is obviously that the surface morphologies of the treated alumina particles have changed. When the alumina particles were treated by acid solution, the surface is still irregular. When the alumina particles were treated by base solution, many pyramids were formed on the particle surface. However, the element composition of the treated alumina was almost unchanged as shown in Figure 4c and 4d. The fluoride adsorption capacities were examined for alumina particles, acid treated and base treated alumina particles with two fluoride concentrations. The results are shown in Figure 5. It shows that the capacity of untreated alumina was 0.24mgg-1at pH=7 and initial fluoride concentration of 23.27mgL-1, and 0.59 mg g-1 when the initial fluoride concentration increased to 48.40mgL-1. When the alumina particles were treated by acid solution, its fluoride adsorption capacity increased to 0.39 and 0.89 mg g-1at the above two initial fluoride concentrations. However, when the alumina particles were treated by base solution, its fluoride adsorption capacity decreased to 0.14 and 0.29 mg g-1 at the above two initial fluoride concentrations. That mainly because treatment change the surface morphology and groups. The mechanism of this phenomenon needs to be further studied. In a word, acid treatment can increase the fluoride adsorption capacity of the alumina particles, while base treatment decrease its fluoride adsorption capacity. Therefore, acid treatment is a convenient way to improve the fluoride adsorption capacity of alumina particles.
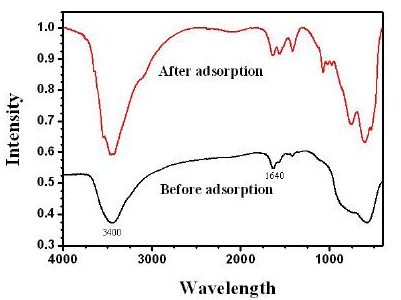
Figure 2 FTIR spectra of Alumina adsorbent before and after fluoride adsorption (pH=7).
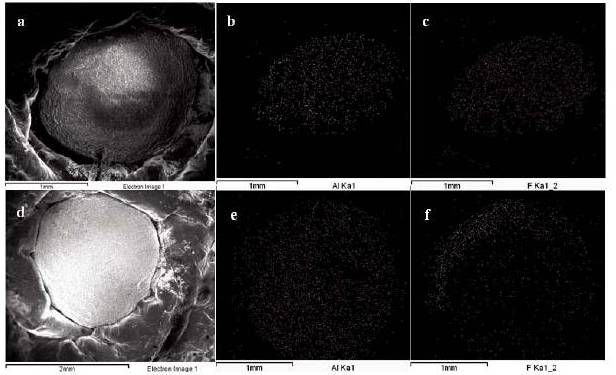
Figure 3 SEM image and EDS mapping of alumina after fluoride adsorption (a) SEM image, (b) EDS mapping of Al in selected area of image (a), (c) EDS mapping of F in selected area of image (a), (d) SEM image of the section of alumina particle after fluoride adsorption, (e) EDS mapping of Al in selected area of image (d), (f) EDS mapping of F in selected area of image (d).
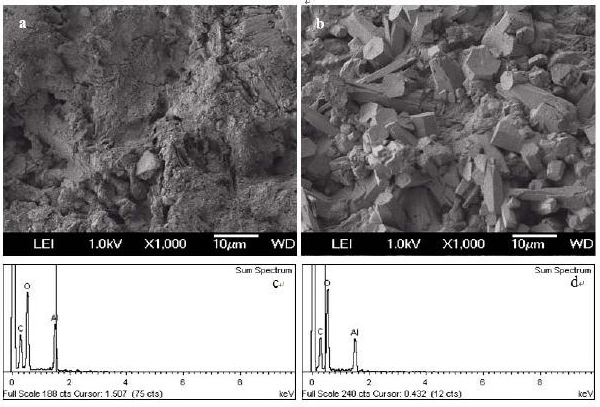
Figure 4 Typical SEM image of treated alumina particles (a) acid treated alumina, (b) base treated alumina, (c) EDS of acid treated alumina, (d) EDS of base treated alumina.
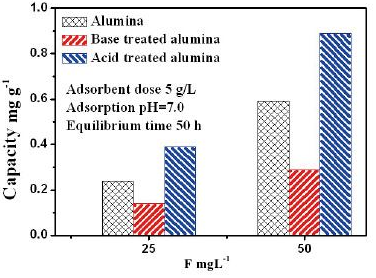
Figure 5 Adsorption capacity of different alumina
4. Conclusion
Fluoride adsorption mainly superficially happened on the alumina particle surface. SEM images show that base treatment caused the alumina particle recrystallize, while acid treatment made the alumina particle more amorphous. The adsorption capacity of acid treated alumina was about twice compared with that of alumina, while the capacity of base treated alumina was only about half of that of alumina at the solution pH=7. And the fluoride adsorption capacity of acid treated alumina reached about 0.89mg g-1 at pH=7 and initial fluoride concentration of 48.40mgL-1. Therefore, acid treatment of alumina is a convenient way to improve its fluoride adsorption capacity from water.
Acknowledgment
Authors wish to express their appreciation of the financial support of this study by the NSFC (No. 20906055 and 20803040) of China and China postdoctoral science foundation (No. 20100470131).
Reference
1. Daifullah A A M, Yakout S M, Elreefy S A. Adsorption of fluoride in aqueous solutions using KMnO4-modified activated carbon derived from steam pyrolysis of rice straw. J. Hazard. Mater. 2007;147:633-643.doi:10.1016/j.jhazmat.2007.01.062.
2. Abe I, Iwasaki S, Tokimoto T, Kawasaki N, Nakamura T, Tanada S. Adsorption of fluoride ions onto carbonaceous materials. J.Colloid Interface Sci. 2004;275:35-39. doi:10.1016/ j.jcis.2003.12.031.
3. Tripathy SS, Bersillon JL, Gopal K. Removal of fluoride from drinking water by adsorption onto alum-impregnated activated alumina. Sep. Purif. Technol. 2006;50:310-317. doi:10.1016/j.seppur.2005.11.036.
4. http://www.epa.gov/waterscience/criteria/drinking/dwstandards.pdf.
5. Wu X M, Zhang Y, Dou X M, Yang M. Fluoride removal performance of a novel Fe-Al-Ce trimetal oxide adsorbent. Chemosphere, 2007;69:1758-1764. doi:10.1016/j.chemos-phere. 2007.05.075.
6. Onyango M S, Matsuda H, Alain T. Chapter 1 Fluoride Removal from Water Using Adsorption Technique. Adv. Fluor. Sci. 2006;2:1-48.
7. Menkouchi Sahli M A, Annouar S, Tahaikt M, Mountadar M, Soufiane A, Elmidaoui A. Fluoride removal for underground brackish water by adsorption on the natural chitosan and by electrodialysis. Desalination. 2007; 212:37-45. doi:10.1016/j.desal.2006.09.018.
8. Garmes H, Persin F, Sandeaux J, Pourcelly G, Mountadar M. Defluoridation of groundwater by a hybrid process combining adsorption and Donnan dialysis. Desalination. 2002;145:287-291. doi:10.1016/S0011-9164(02)00424-1.
9. Ayoob S, Gupta A K, Bhakat P B, Bhat V T. Investigations on the kinetics and mechanisms of sorptive removal of fluoride from water using alumina cement granules. Chem. Eng. J. 2008;140:6-14. doi:10.1016/ j.cej.2007.08.029.
10. (a)Raichur A M, Jyoti Basu M. Adsorption of fluoride onto mixed rare earth oxides. Sep. Purif. Technol.2001;24:121-127. doi:10.1016/S1383-5866(00)00219-7 (b) Zhou Y, Yu C, Shan Y. Adsorption of fluoride from aqueous solution on La3+-impregnated cross-linked gelatin. Sep. Purif Technol. 2004;36:89-94. doi:10.1016/S1383-5866(03)00167-9.
11. Luo F, Inoue K. The removal of fluoride ion by using metal(III)-loaded amberlite resins. Solvent Extr. Ion Exch. 2004;22:305-322. doi:10.1081/SEI-120028007.
12. Lai C H, Lo S L, Chiang H L. Adsorption/desorption properties of copper ions on the surface of iron-coated sand using BET and EDAX analyses. Chemosphere. 2000;41:1249-1255. doi:10.1016/S0045-6535(99)00534-2.
13. Zhang Y, Yang M, Huang X. Arsenic(V) removal with a Ce(IV)-doped iron oxide adsorbent. Chemosphere. 2003;51:945-952. doi:10.1016/S0045-6535(02)00850-0.
Received 15 November, 2010; accepted 6 December, 2010; published online 15 December, 2010.
Copyright:(c) 2010 H. Wu, et al. This is an open-access article distributed under the terms of the Creative Commons Attribution License, which permits unrestricted use, distrib-ution, and reproduction in any medium, provided the original author and source are credited.

|
Nano Biomedicine and Engineering. Copyright © Shanghai Jiao Tong University Press |
 |