Electroencephalogram Based Stress Detection using Extreme Learning Machine
Mousa K. Wali*, Rashid Ali Fayadh, Nabil K. Al_shamaa
College of Electrical Engineering, Middle Technical University, Baghdad, Iraq
*Corresponding author. E-mail: drmusawali4@gmail.com
Received: Apr. 30, 2022; Revised: Oct. 26, 2022; Accepted: Nov. 14, 2022; Published: Nov. 30, 2022
Citation: M. K. Wali, R. A. Fayadh, N. K. Al_shamaa. Electroencephalogram based stress detection using extreme learning machine. Nano Biomedicine and Engineering, 2022, 14(3): 208–215.
DOI: 10.5101/nbe.v14i3.p208-215
Abstract
The detection of stress is important because it contributes to diverse pathophysiological changes
including sudden death. Various techniques have been used to evaluate stress in terms of questionnaire or by quantifying the changes of physiological signals. Electroencephalogram signals are highly useful in measuring human stress. Therefore, to solve and detect stress problem, this work had extracted electroencephalogram features of theta, alpha, and beta bands in the frequency domain by wavelet packet transform because these bands are concerned with stress. In this research four features have been supplied to extreme learning machine which gave accuracy of 98.56% of detecting stress from normal state based on db4 with an average sensitivity of 92.52% and specificity of 95.88%. This research studied the stress on 15 students due to mathematical exercises in a noisy environment with different stimulus.
Keywords: Electroencephalogram; Kurtosis; Wavelet packet transform; Extreme learning machine
Introduction
Detection of stress is important because it contributes to diverse pathophysiological changes including sudden death [1]. Various techniques have been used to evaluate stress in term of questionnaire based or by quantifying the changes of physiological signals. People have evaluated their severity of stress based on their scale and what they felt because stress caused the imbalance in sympathetic and parasympathetic level in human autonomous nervous system (ANS) [2].
With the great progression in computer technology and signal processing methods, determining stress has tended to make use of other methods by using physiological signals such as electroencephalogram (EEG) with changes in the central nervous systems (CNS) activities [3–5]. An EEG signal is a low frequency oscillatory wave, and most of the meaningful information about the human brain is reflected in the frequency range of 0.5‒70 Hz. EEG signals are mostly analyzed by using five different frequency bands, which are delta (0–4 Hz), theta (4–8 Hz), alpha (8–12 Hz), beta (14–32 Hz), and gamma (32–64 Hz). Delta waves occur during deep and with unconscious sleep while theta occurs when a person is in light sleep or in quiet focus. Meanwhile, alpha indicates the case of people in consciousness or happens through periods of relaxation with their eyes closed but not sleep and it is dominant in the rest or drowsiness stage [6]. Beta wave arises in mental thinking state and decreases during distraction, and it is seen in the frontal and central locations [7]. Among the EEG bands, theta, alpha, and beta give more meaningful information than other EEG bands. Majority of the research works discuss EEG signals using a frequency ranging up to 40 Hz for different applications such as stress assessment, sleep disorder analysis, emotion, hypovigilance, migraine, epilepsy, neuron muscular disorder prediction, etc [8–11]. In addition to EEG, some research used other physiological signals namely, electrocardiography (ECG), skin temperature (ST), electromyography (EMG), and blood pressure (BP). The mental stress depends upon the amplitude of the event-related potential (ERP) P300, which decreases when stress level increases [12] as the brain activity in the left side is less than the right frontal for people under stress [13]. The transitional and post-transitional fatigue of the driver has been investigated that beta amplitude in frontal hemisphere of stress subject is larger compared to non-stress subject [14]. The stress pattern can be demonstrated by a decrease of power in alpha band and increase of power in beta band [15] on prefrontal cortex (PFC) [16]. Theta/beta ratio is considered as an EEG indicator in attention of hyperactivity disorder diagnosis in case of the arousal deficit [17]. The power spectral ratio (α+θ)/β showed an increase during fatigue detection [18]. The combination of spectral centroid technique and EEG asymmetry can be used as a feature to unique pattern detection of human stress [19]. As raw data passes through a signal filtration process which extracts a band and filters other irrelevant bands and noises [20]. Detailed information about filtering EEG signals can be found in the Python-MNE library documentation [21]. Finally for measuring human stress, EEG signal especially depend on theta, alpha, and beta band. In this work, the author did the hybrid of EEG bands features extracted by wavelet packet transform (WPT) with higher order statistical parameters namely, skewness and kurtosis to determine the stress accurately.
Materials and Methods
Experimental setting
EEG signal is a low frequency oscillatory wave, and most of the meaningful information about the human brain is reflected in the frequency range of 0.5–70 Hz. Majority of the research works discuss EEG signals using a frequency ranging up to 40 Hz for stress assessment. Twelve electrodes of the EMOTIV wireless device were used to acquire the EEG signals in addition to one reference electrode placed on left earlobe and one ground electrode on right earlobe. Impedance of the active electrodes was kept below 5 kΩ and they contact the entire scalp according to International 10–20 system. EEG signals were recorded by a sampling frequency of 128 Hz with band-pass filter whose first cutoff frequency is 0.05 Hz and second cutoff frequency is 60 Hz.
A simulated environment was created in our university research cluster, as shown in Fig. 1.
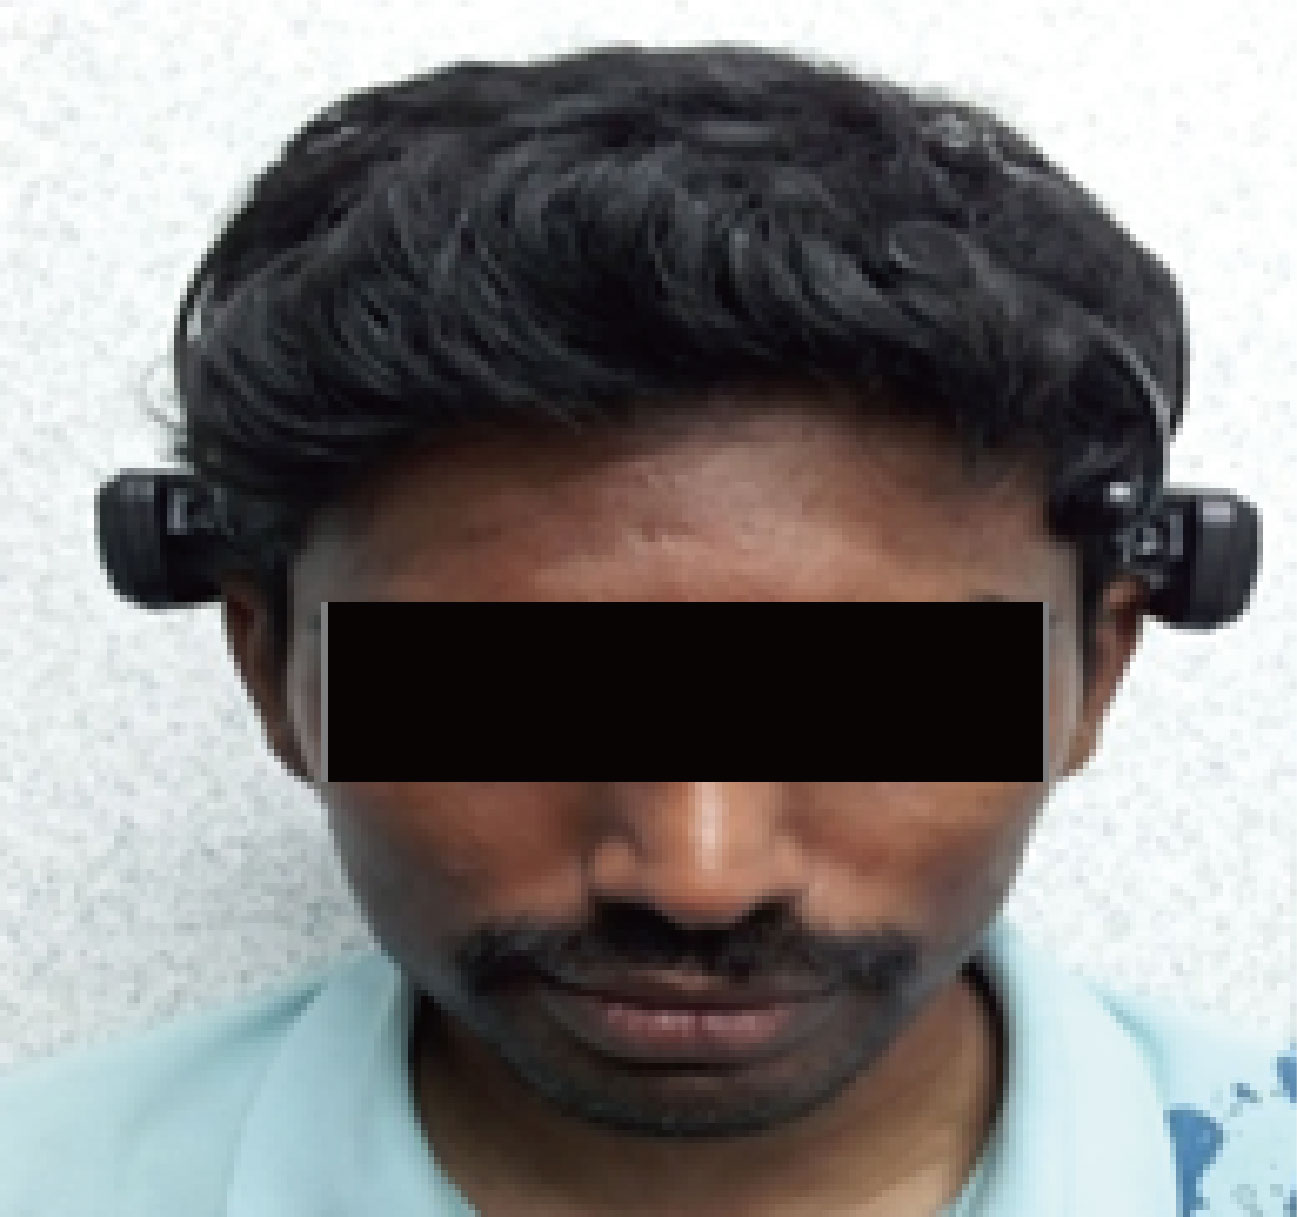
Fig. 1 Recording EEG of subject under stress
Fifteen participants were fulfilled mathematic exercises combined with audio distraction to affect
the cognition of the subject because arithmetic task is widely used to elicit stress in mental stress studies. Beta power is increased in the mental arithmetic task unlike rest state [22–25]. While doing this mental demand during 50 min experiment started from easy math exercise up to hard level, the subject should report the time of feeling stress by signing on the paper.
Wavelet packet transform
The discrete wavelet transform (DWT) is always used to extract time-frequency features unlike the Fourier transform, or autoregressive modeling which operates in only one domain [26]. This property of the wavelet method has been applied in several signal processes applications. The major issue to be addressed before using DWT is the choice of wavelet function which is based on type of physiological signals used for the given application [27]. Among the different types of wavelet families, three wavelet families, sym, coif and db were used for detecting the stress in EEG signals such as “db4,” “db8,” “sym8” and “coif5” that were used in this present work because these wavelet functions got similarity with EEG characteristics [23, 28]. DWT is mainly useful to decompose the input signal into a set of approximation and detail coefficients and just the approximation coefficients are further decomposed into several levels. The WPT is used to decompose both approximation and detail coefficients, as shown in Fig. 2, where b1–b5 means
level1–level5.
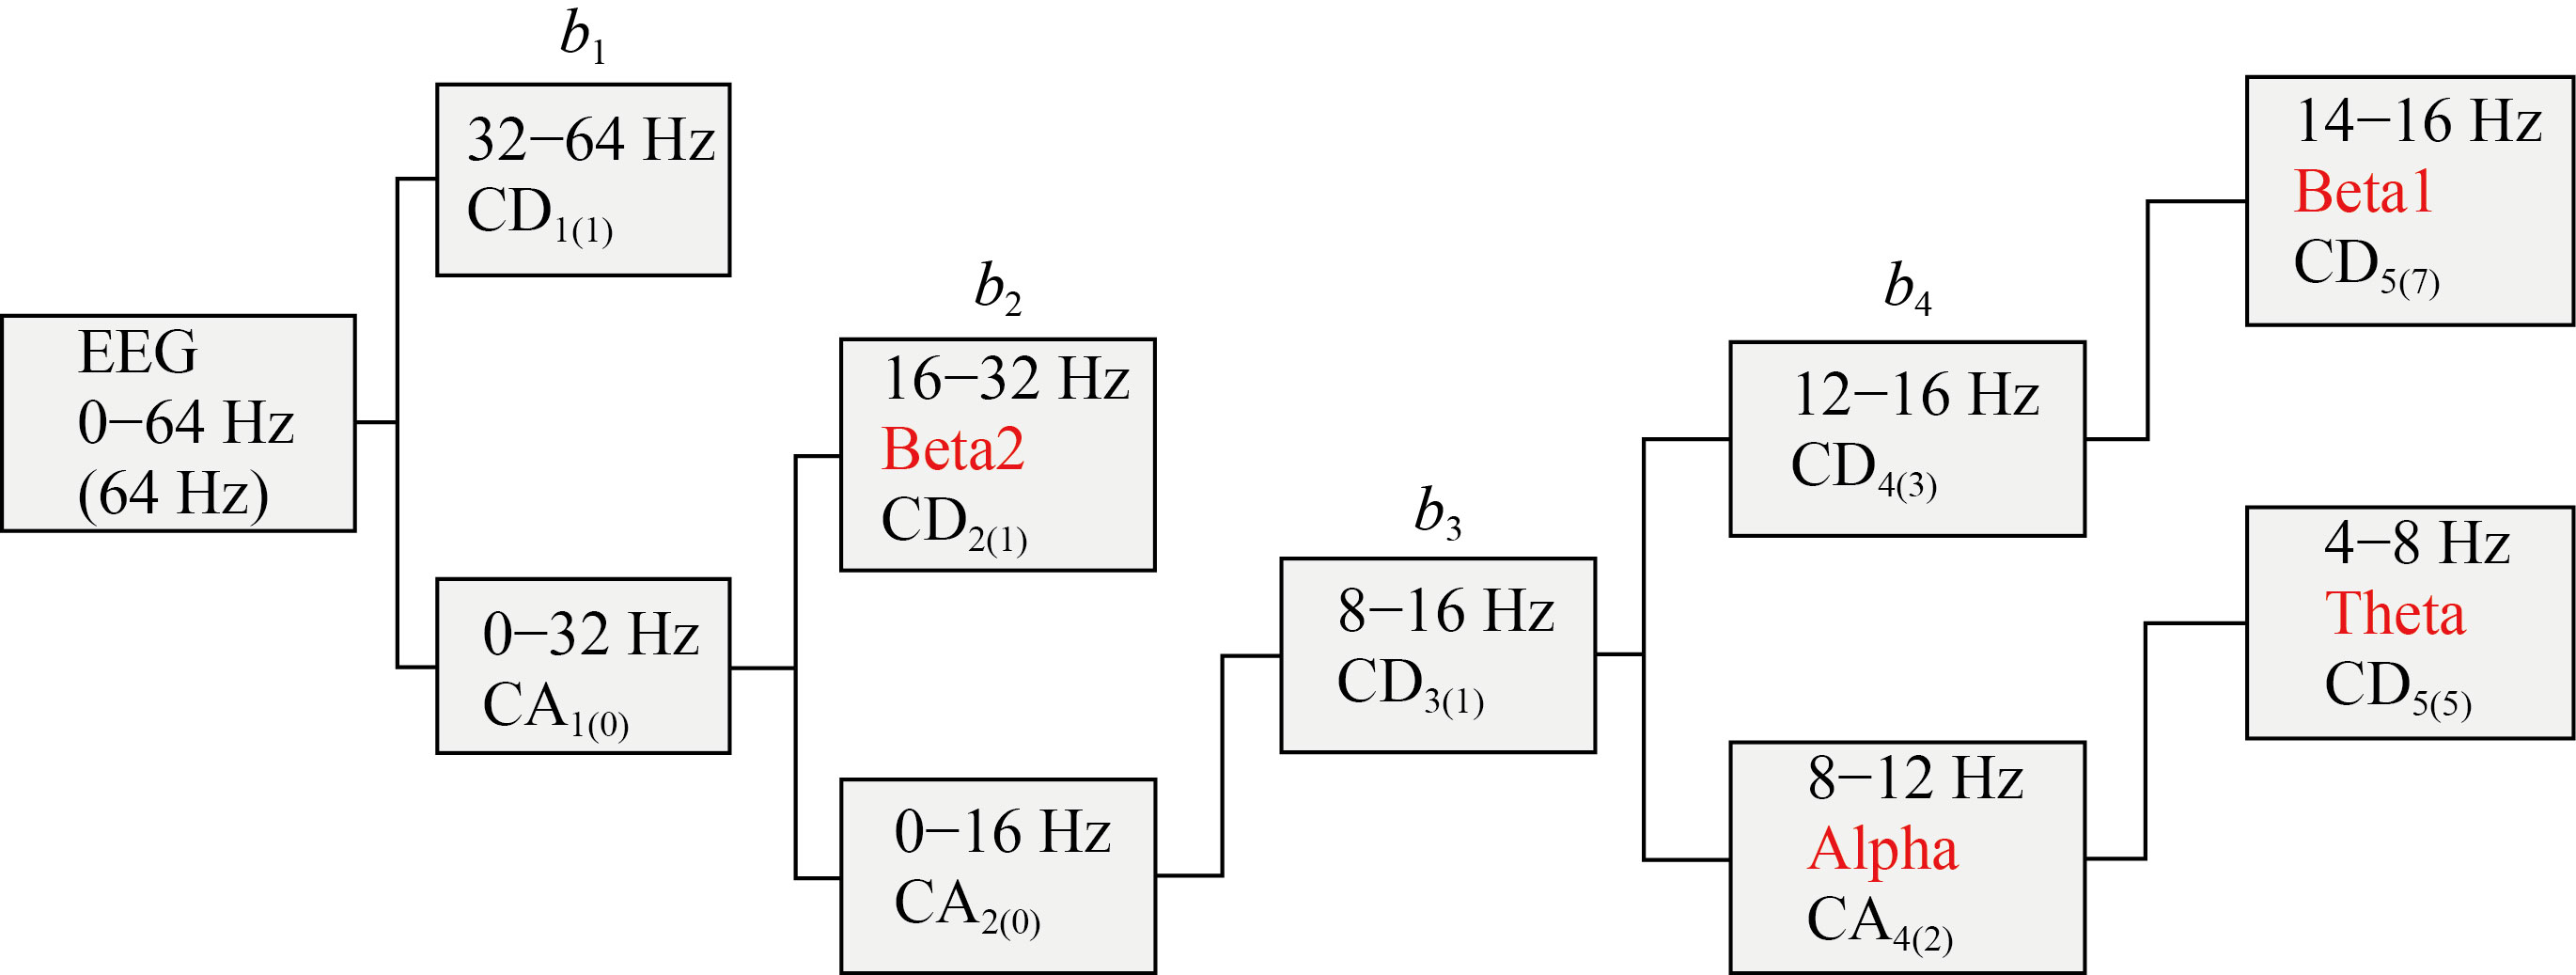
Fig. 2 Five level decomposition of input EEG signals with a sampling frequency of Fs = 128 Hz using WPT
This WPT is playing a vital role in analyzing the physiological signals to obtain finer information of the EEG bands mentioned in Table 1.
Table 1 EEG bands frequencies and its coefficient position
Frequency range (Hz) | Decomposition level | EEG band | Bandwidth (Hz) | Coefficient position |
0—4 | WPT 5-4 | Delta | 4 | CA5(4) |
4 — 8 | WPT 5-5 | Theta | 4 | CD5(5) |
8 — 12 | WPT 4-2 | Alpha | 4 | CA4(2) |
14 —16 | WPT 5-7 | Beta1 | 2 | CD5(7) |
16 — 32 | WPT 2-1 | Beta2 | 16 | CD2(1) |
The relation between the input samples and both filter coefficients (low and high pass) for generating approximation and detail coefficients for any level j can be stated as in [29]:
![]() (1)
(1)
![]() (2)
(2)
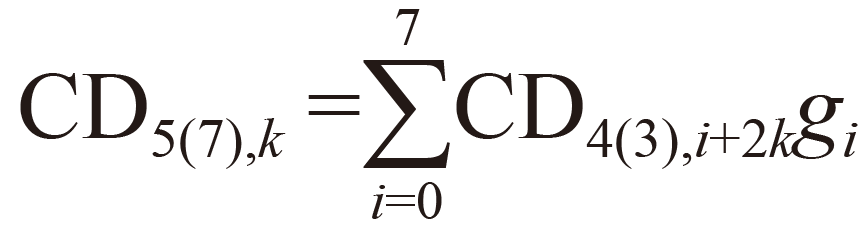
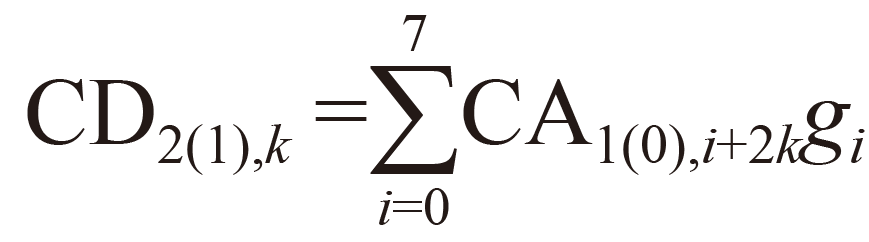
where M represents the number of wavelet filters coefficients, j is the wavelet transform level, k is the approximation or detailed coefficient item at any level, gi is the high pass filter coefficients and hi is the low pass filter coefficients. Both gi, hi are derived from the wavelet and scaling functions respectively. The WPT equations for extracting theta, alpha, beta 1 and beta 2 respectively are shown in [29].
![]() (3)
(3)
![]() (4)
(4)
 (5)
(5)
 (6)
(6)
When working in the frequency domain, it is highly needed to take two important features namely, power spectral density and spectral centroid. Random signal usually has finite average power; therefore can be characterized by an average power spectral density (PSD) as shown in [30].
![]() (7)
(7)
where E is the average of |X(w)|2, X(w) and T are the Fourier and the total duration of the input signal respectively. The second feature is the spectral centroid which is commonly known as sub band spectral centroid [30].
The spectral centroid is used to find the center value of the groups for each frequency band and is calculated by [19].
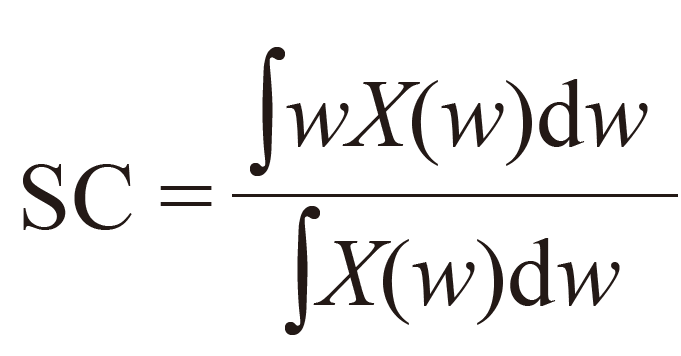 (8)
(8)
The last two mentioned features are not enough to analyze EEG bands activities; therefore another higher order statistical parameters namely, skewness and kurtosis must be used in this reseach [31]. For data X1, X2, …, XN, kurtosis and skewness can be computed as
![]() (9)
(9)
![]() (10)
(10)
where ![]() is the mean, S is the standard deviation, and N is the number of data points.
is the mean, S is the standard deviation, and N is the number of data points.
Extreme learning machine (ELM)
ELM was first introduced by Ref. [32] as it needs only a single iteration to its learning process. ELM is a learning algorithm for the single hidden layer feed forward neural networks (SLFNs) and it is trained adaptively by setting the hidden layer node number and randomly assigning the input weights and hidden layer biases. The output layer weights are obtained by the least square method. An illustration of the ELM algorithm is shown in Fig. 3, and its mathematical model is represented by [33]
![]() (11)
(11)
where i = 1, 2, ..., N, wi represents the weights, B is the number of nodes, βi is the outputs of the nodes of the hidden layer, bi is the biase of each node of the input layer, and xi is the input values to the nodes of the input layer.
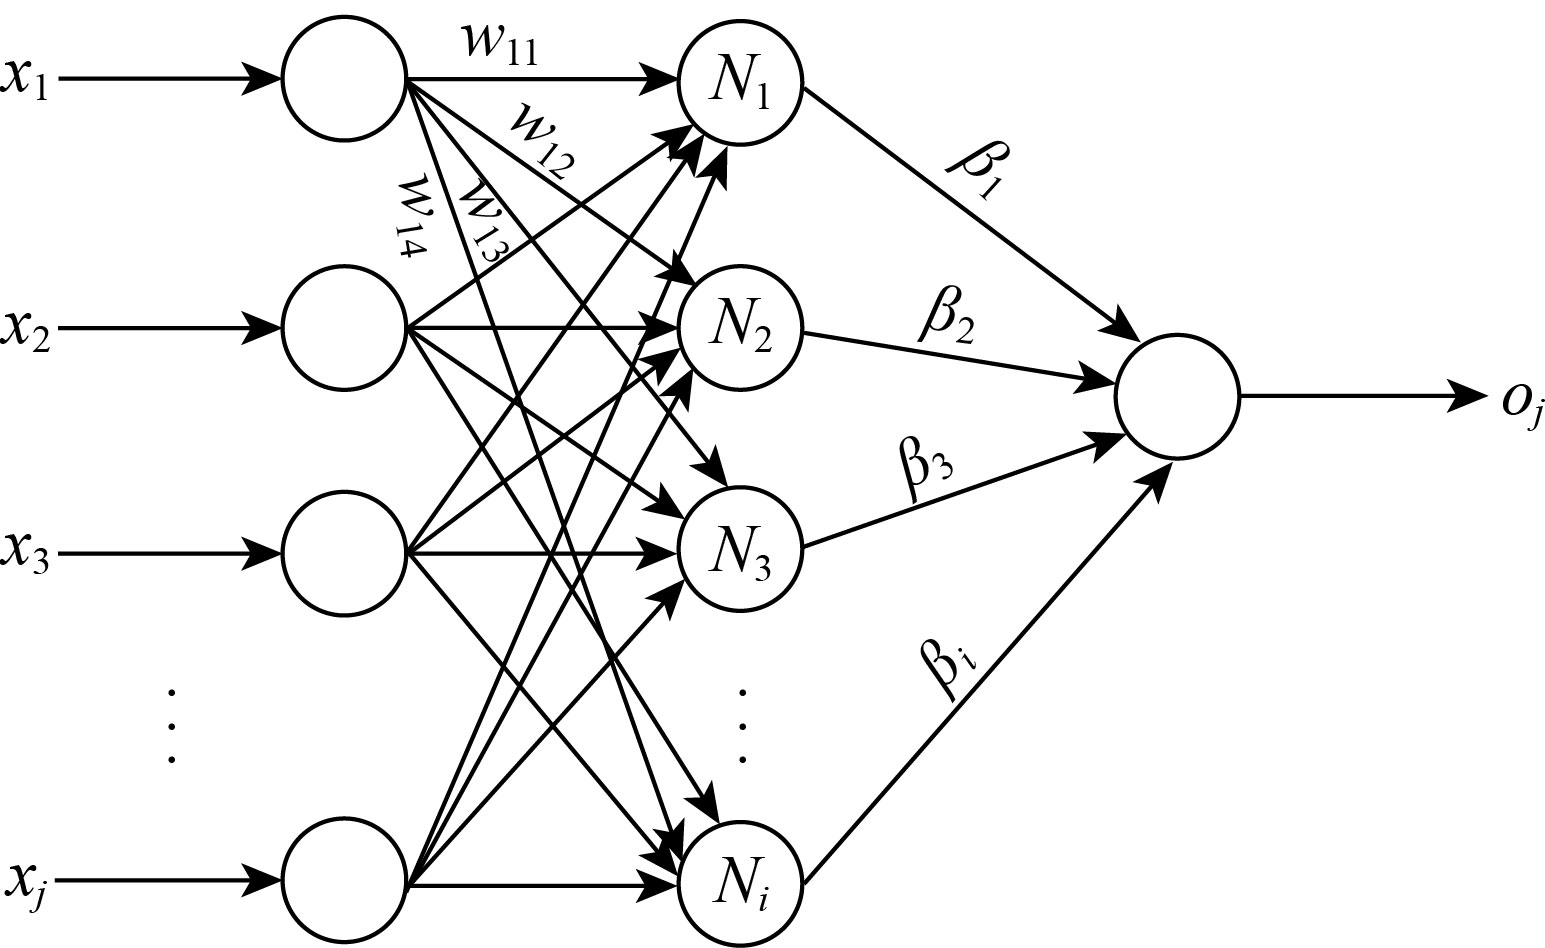
Fig. 3 ELM classifier structure
Hence the overall vectors over two cases (normal & stress) are 90 vectors (15 subjects×2×3) for the theta, alpha, and beta bands of EEG on one statistical feature. Therefore, the overall vectors for 4 statistical features are 360 (90×4). This proposed work used 70% (252 vectors) for training and remaining 30% (108 vectors) are used for testing the system.
Results and Discussion
The results of this work depend on the Matlab system software which is related to the protocol mentioned in the experimental setting. Fifteen participants were fulfilled mathematic exercises combined with audio distraction to affect the cognition of the subject as arithmetic task is widely used to elicit stress in mental stress studies. EEG signal is a low frequency oscillatory wave, and most of the meaningful information about the human brain is reflected in the frequency ranging of 0.5–70 Hz. Majority of the research works discuss EEG signals using a frequency range up to 40 Hz for stress assessment.
EEG bands spectrum
Based on the previous studies, for measuring human stress, EEG signal especially depends on theta, alpha, and beta band. The WPT extracted these bands as shown in Fig. 4. Their average spectrum clearly shows different spectrums for these bands in stress state.
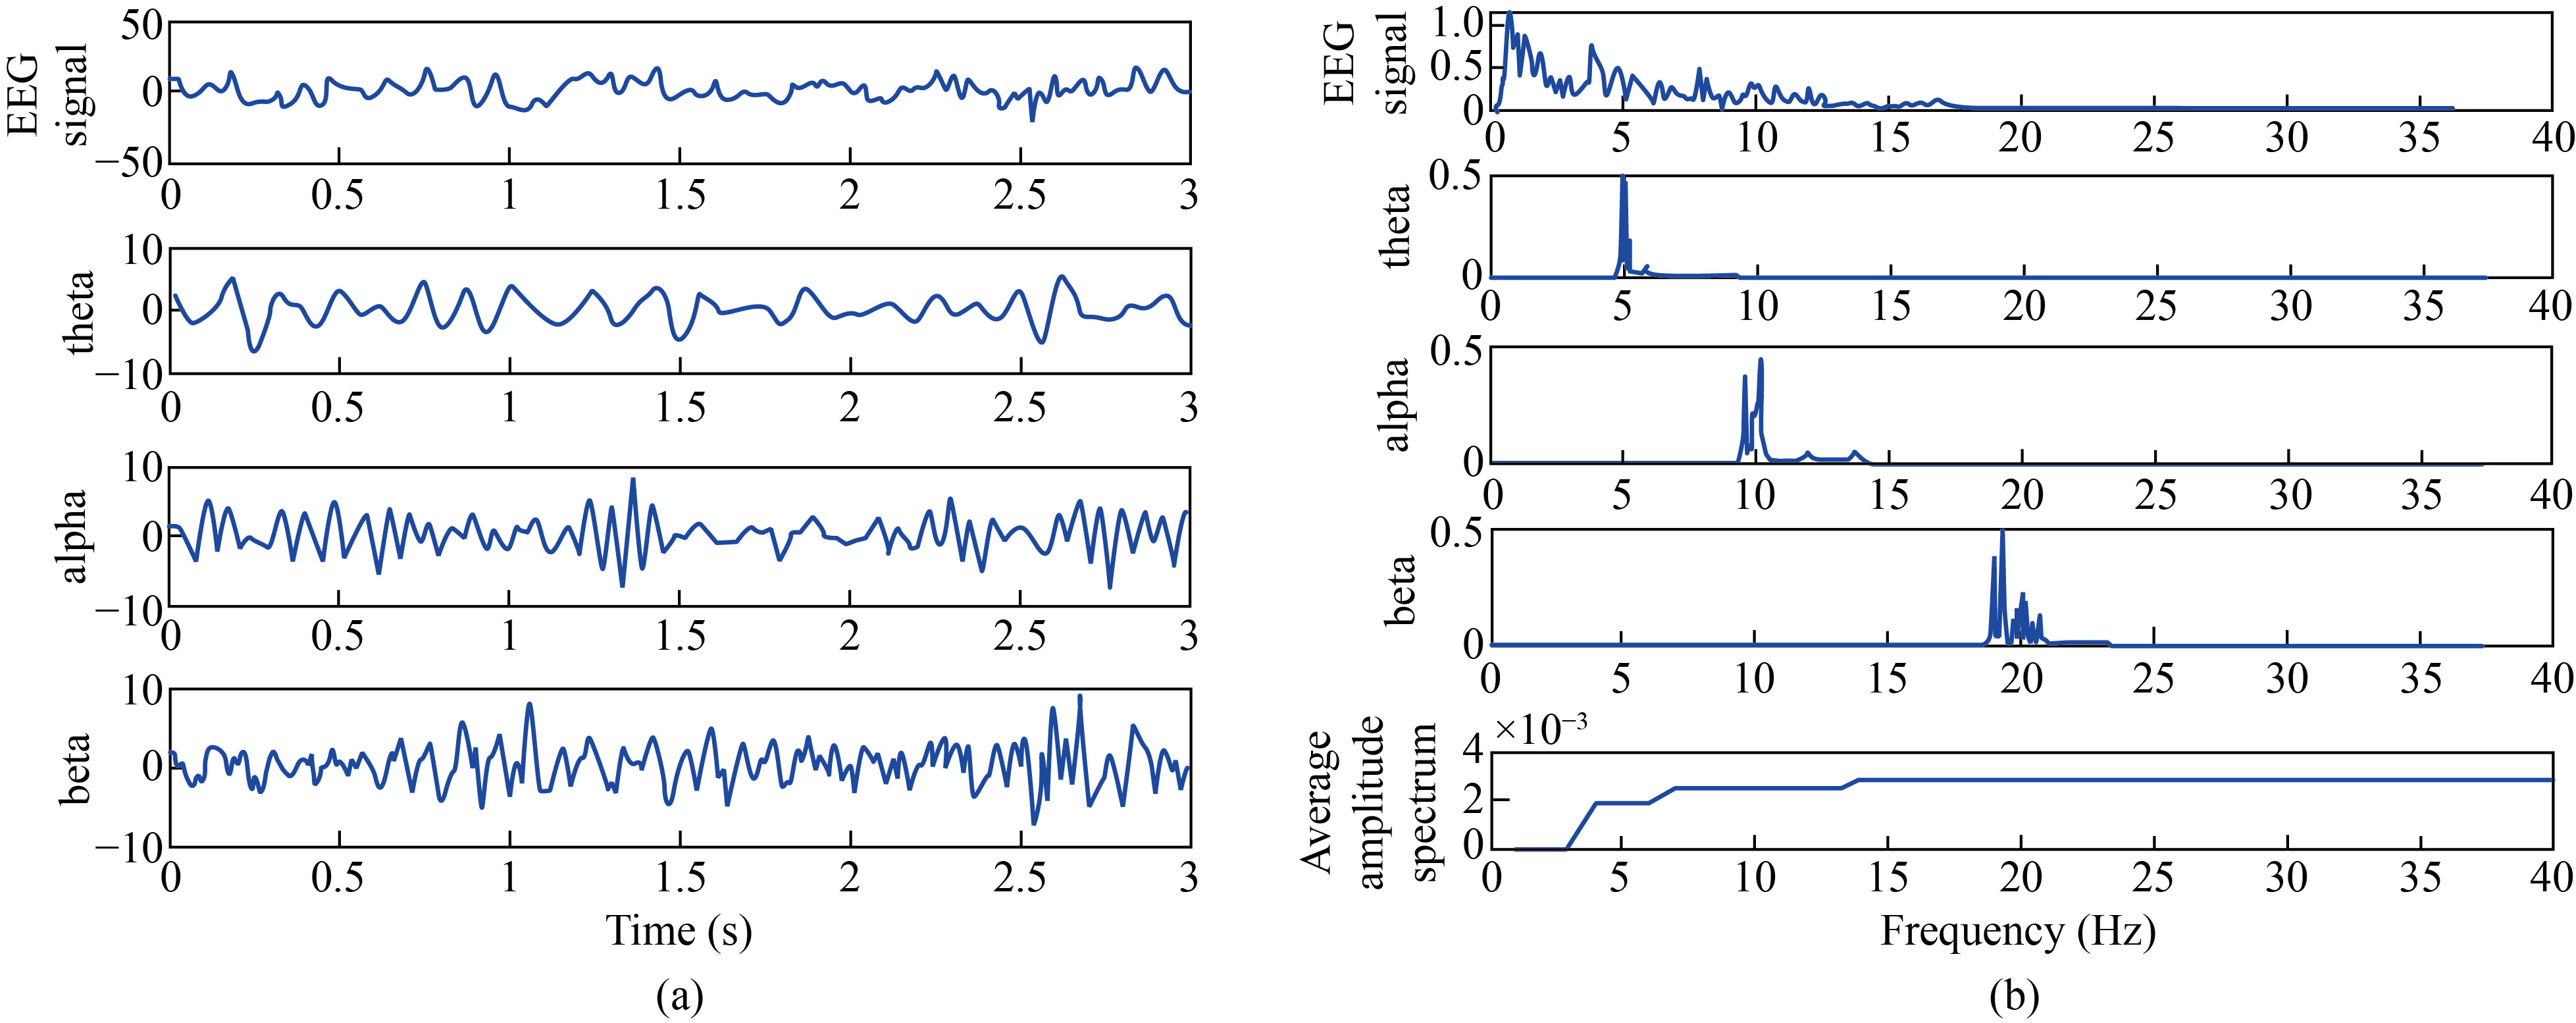
Fig. 4 EEG signal of stress state of the subjects using WPT. (a) Preprocessed EEG signal and its frequency bands; (b) Amplitude spectrum of EEG signal and its bands
For discriminate stress state from neutral, the PSD average of each subject within each band had been taken against the stimulus time as shown in Fig. 5 which indicates clearly the difference between them as theta or alpha bands decreased for the subjects who took more time in the stress stimulus. While the average PSD of the beta band increased for the subject who continued for longer time in stress stimulus. Therefore, it is clearly possible to rely on the power spectrum features; both PSD and SC are used for stress detection in addition to the higher order statistical
features mentioned before, namely, skewness and kurtosis.
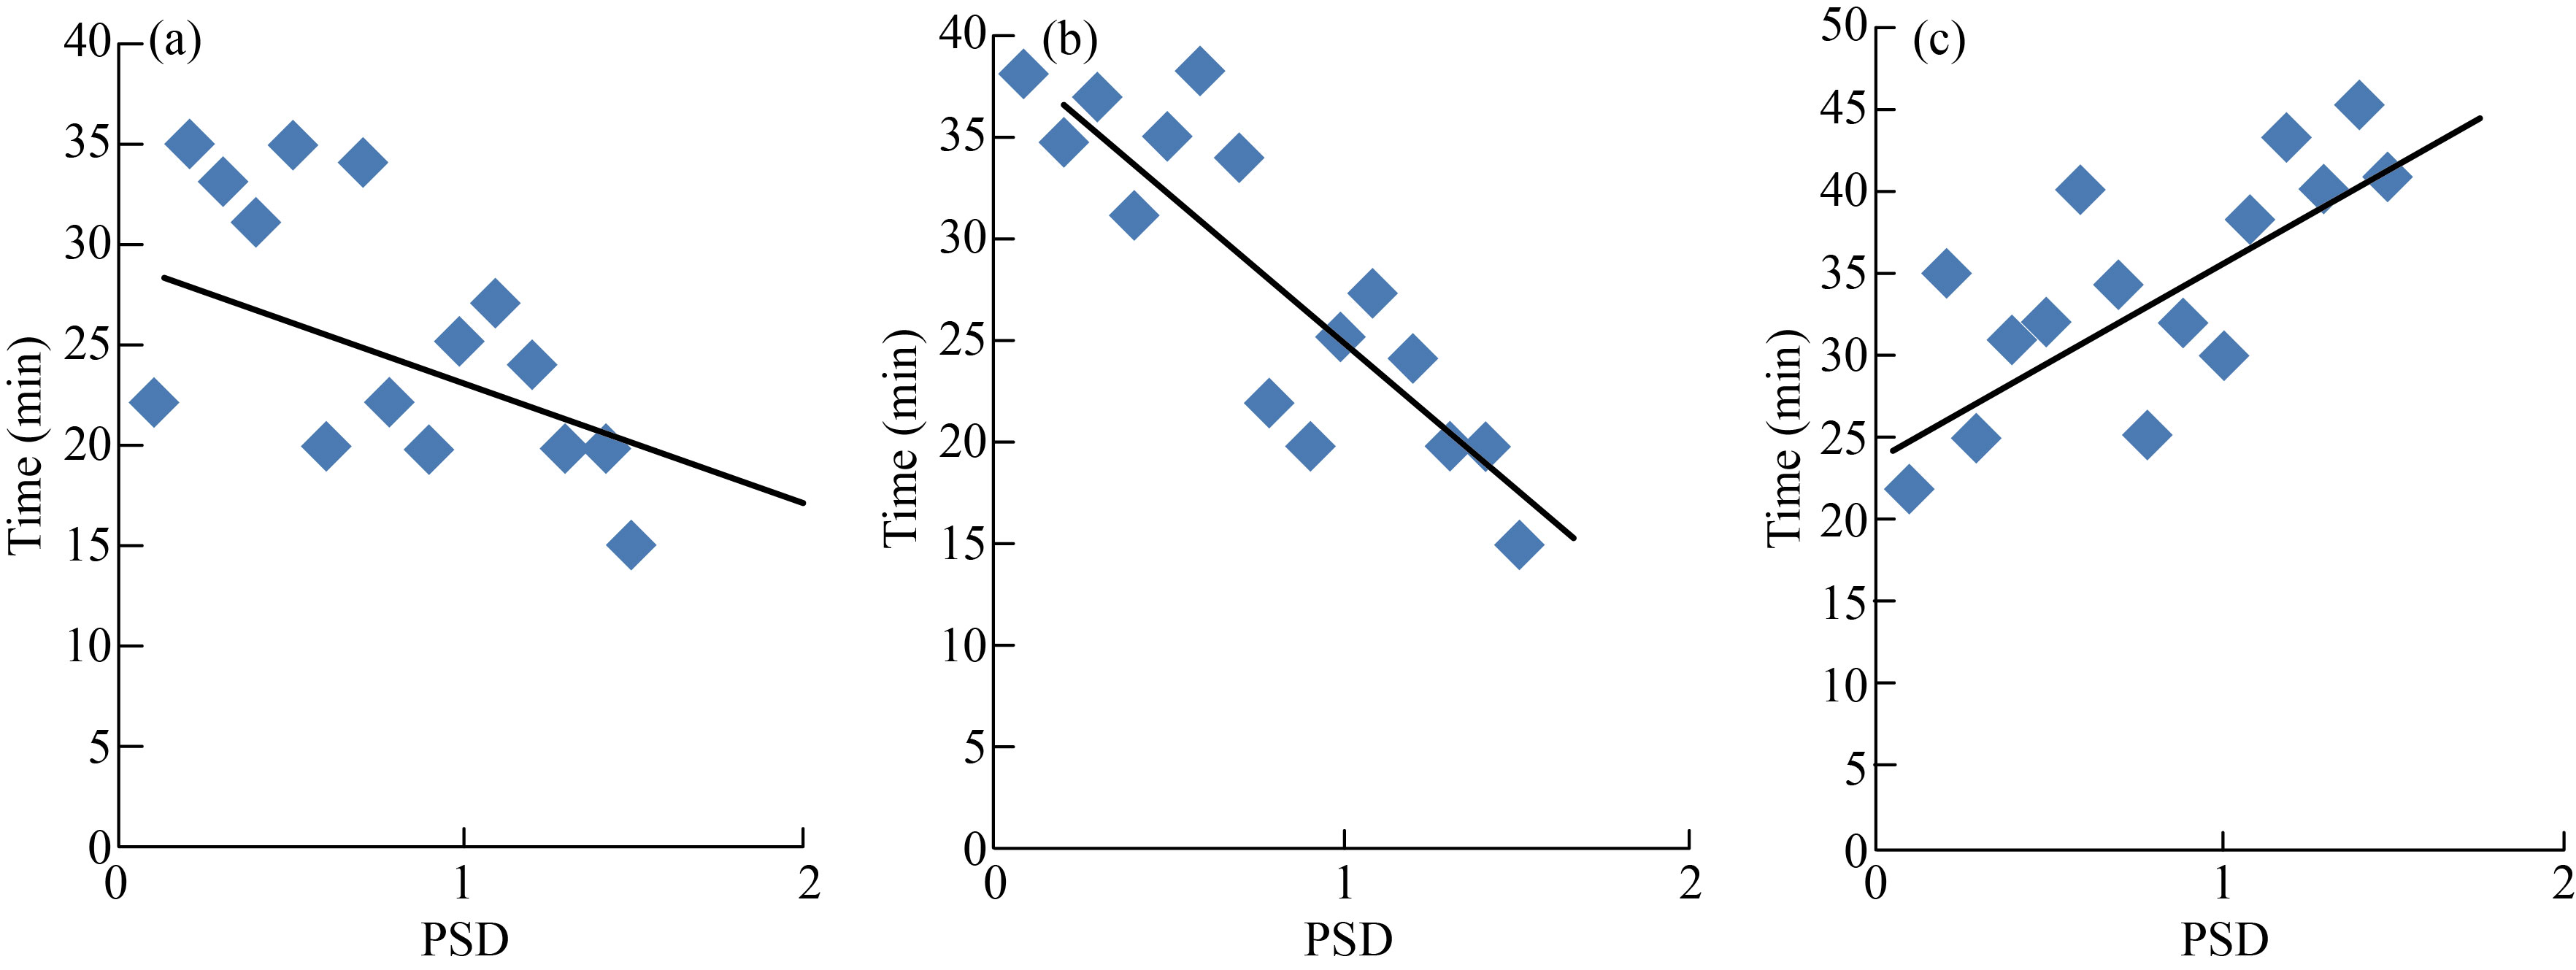
Fig. 5 PSD against stimulus time. (a) Theta; (b) Alpha; (c) Beta
ANOVA test and classification
The results of ANOVA test performed on these four statistical features to distinguish the stress state from normal, as shown in Table 2. Among the different types of wavelet families, three wavelet families, sym, coif and db were used for detecting the stress in EEG signals such as “db4,” “db8,” “sym8” and “coif5” that were used in this present work because these wavelet functions got similarity with EEG characteristics. In db4 and sym8, both statistical features SC and PSD are linearly increasing its mean value from the normal state to stress with a maximum significance value of P < 0.005. This indicates that the features derived from these wavelet functions got higher values of discrimination property between normal and stress compared with other wavelet functions. However, the features derived using coif5 wavelet function has less significance value on distinguishing stress (P > 1).
Table 2 ANOVA test of features over db4, db8, sym8, coif5 method for stress discrimination
Wavelet | Feature | Normal | Stress | P |
db4 | kurtosis | 13.98 ± 32.17 | 6.26 ± 11.08 | 0.241 |
skewness | 0.317 ± 1.28 | 0.019 ± 0.084 | 0.262 | |
SC | 8.98 ± 14.25 | 29.9 ± 39.26 | 0.001 | |
PSD | 0.078 ± 0.0173 | 1.12 ± 4.3 | 0.003 | |
db8 | kurtosis | 4.2 ± 7.85 | 0.19 ± 10.6 | 0.152 |
skewness | 0.05 ± 0.014 | 0.078 ± 0.012 | 0.245 | |
SC | 7.66 ± 14.13 | 5.6 ± 7 | 0.135 | |
PSD | 0.04 ± 0.014 | 0.014 ± 0.038 | 0.324 | |
sym8 | kurtosis | 21.02 ± 37.7 | 15.6 ± 19.8 | 0.434 |
skewness | 0.41 ± 2.7 | 0.03 ± 0.054 | 0.445 | |
SC | 1.29 ± 2.2 | 25.65 ± 40+.62 | 0.001 | |
PSD | 0.0047 ± 0.012 | 0.077 ± 0.027 | 0.003 | |
coif5 | kurtosis | 18.92 ± 31.96 | 4.6 ± 8 | 1.232 |
skewness | 8.29 ± 14.92 | 0.005 ± 0.01 | 1.986 | |
SC | 22.71 ± 31.48 | 15.15 ± 26.51 | 1.008 | |
PSD | 0.243 ± 1.25 | 0.017 ± 0.037 | 1.078 |
The result of the ANOVA test concludes that, the proposed four statistical features derived from four different wavelet functions are highly efficient to distinguish stress case. Hence, these features will be given into the ELM classifier for classifying.
Nevertheless, it is very important to determine which feature and wavelet can be the dominant in stress case. Therefore, the average values of each feature within EEG band of all the subjects for each wavelet in stress case had been taken as shown in Fig. 6 which indicate that SC within db4 got the highest level for discrimination.
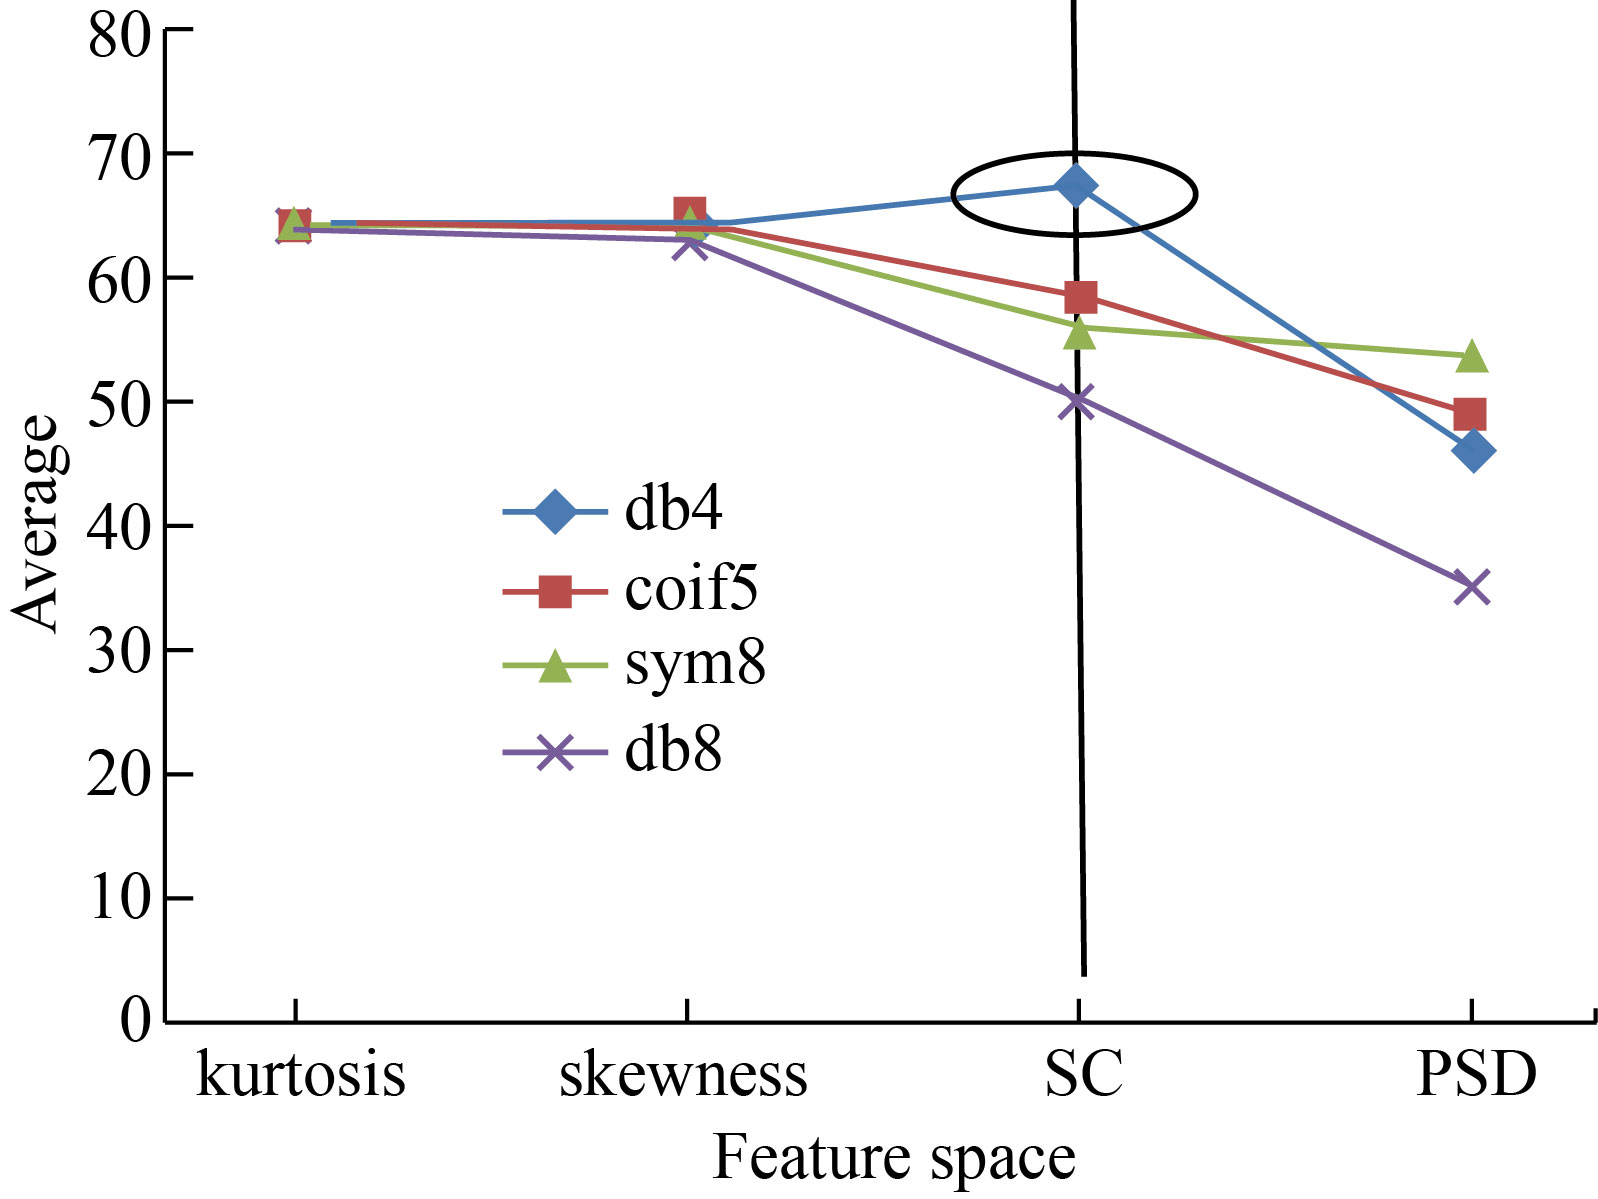
Fig. 6 Comparison of features average values of different wavelets
The ELM classifier result in Table 3 summarizes the detection accuracy for the four features under db4, db8, sym8, and coif5 for stress detection. The best performance of detection of 98.78% was achieved by ELM using SC feature with an average sensitivity of 92.52% and specificity of 95.88% based on db4.
Table 3 Stress classification accuracy of different features under different wavelets %
Feature | Db4 | Db8 | Sym8 | Coif5 | ||||
Normal | Stress | Normal | Stress | Normal | Stress | Normal | Stress | |
kurtosis | 72.22 | 63.89 | 75.00 | 59.44 | 52.78 | 60.00 | 61.67 | 57.22 |
skewness | 41.11 | 36.11 | 75.00 | 72.22 | 41.11 | 34.44 | 33.89 | 70.00 |
SC | 56.67 | 98.78 | 53.89 | 66.11 | 46.67 | 91.43 | 60.00 | 41.11 |
PSD | 59.44 | 40.00 | 57.78 | 40.56 | 60.00 | 73.89 | 73.33 | 63.33 |
Therefore as shown in Fig. 7, db4 wavelet can be considered as the dominant wavelet type for geting good accuracy of stress detection based on SC feature, while sym8 got 91.43% as the second highest accuracy.
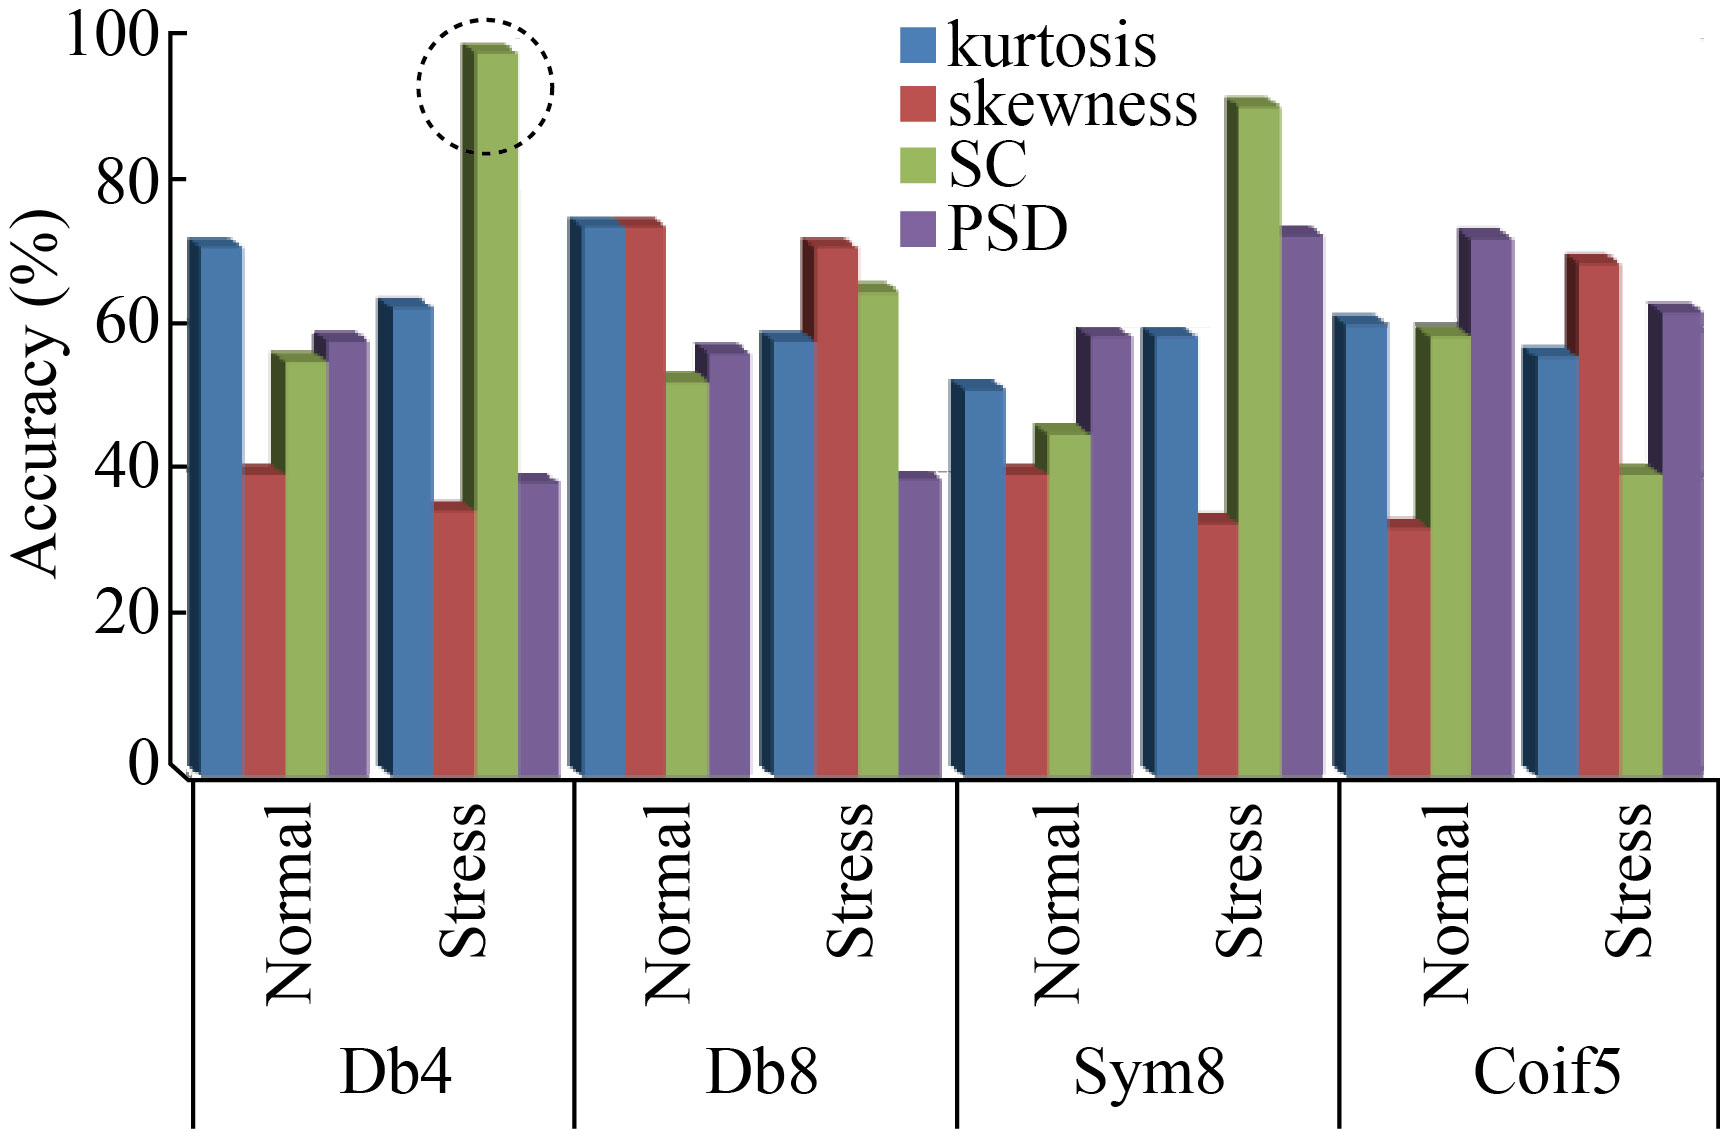
Fig. 7 Highest stress detection accuracy by db4 wavelet and SC feature
Previous researches comparison
From Table 4, Ref. [34] achieved a classification rate of 83% based on fast Fourier transform (FFT), with K-nearest neighbor (KNN) classifier. Reference [35] got same accuracy by extracting features from time domain but utilizing more advanced classifier such as support vector machine (SVM). Therefore, in the present work, more robust classifier such as the ELM classifier has been used. Reference [36] used SVM based on FFT features extraction but got low accuracy of 78.57% because of utilizing one channel EMG. Reference [37] got the lowest accuracy of 71.76% because of utilizing time domain features and KNN classifier. Reference [38] got highest accuracy of 98% because of utilizing bank filters method to separate theta, alpha, and beta bands with consuming more processing time. Finally, the present work makes benefits from the defects of the previous researches by using 14 EEG channels, wavelet packet transform (WPT) rather than bank fitters, and ELM classifier to get accuracy of 98.78%.
Table 4 Comparison of present work with previous researches
Reference | Physiological Signals | Data base | Feature Extraction | Classifier | Accuracy(%) |
[35] | EEG, 24channnel | 17 subjects | FFT | KNN | 83 |
[36] | EEG, 5 channel | 12 subjects | Time domain features | SVM | 82 |
[36] | EEG,1 channel | 8 Subjects | FFT | SVM | 78.57 |
[37] | EEG, 32 channel | 25 Subjects | Time domain features | kNN | 71.76 |
[38] | EEG, 19 channel | 10 subjects | Bank filter | KNN
| 98 |
Present work | EEG, 14 channel | 15 Subjects | WPT | ELM | 98.78 |
Conclusion
In this research, the stress can be detected depending only on the EEG three bands namely, theta, alpha, and beta which were filtered by wavelet packet transform with db4, db8, sym8, coif5. Two features, PSD and SC have been extracted from the average amplitude spectrum supported by two higher order statical features (skewness and kurtosis). The proposed methodology has been tested on 15 subjects getting P-value< 0.005 for PSD and SC features, indicating their capability to discriminate the stress state. Those four mentioned features were supplied to the ELM classifier which gave accuracy of 98.78% based on db4 wavelet and spectral centroid feature.
Conflict of Interests
The authors declare that no competing interest exists.
Reference
[1] J.E. Dimsdale. Psychological stress and cardiovascular disease. Journal of the American College of Cardiology, 2008, 51: 1237–1246. https://doi.org/10.1016/j.jacc.2007.12.024
[2] J.A. Healey, R.W. Picard. Detecting stress during real-world driving tasks using physiological sensors. IEEE Transactions on Intelligent Transportation Systems, 2005, 6: 156–166. http://dx.doi.org/10.1109/TITS.2005.848368
[3] L. Wang, T. Yu, B.C. Wen. Assessment based on nonlinear parameters of EEG α waves for human-body fatigues. Journal of Northeastern University (Natural Science), 2005, 26: 1174–1177.
[4] S. Yan, J.Q. Wei, Y.H. Wu, et al. Study of EEG features extraction for doze car drive. Chinese Journal of Biomedical Engineering, 2005, 24: 110–113. http://dx.chinadoi.cn/10.3969/j.issn.0258-8021.2005.01.024
[5] L.Y. Zhang, C.X. Zheng, X.P. Li, et al. Measuring Kolmogorov entropy of EEG for studying the state of mental fatigue. Chinese Journal of Biomedical Engineering, 2007, 26: 170–176. http://dx.chinadoi.cn/10.3969/j.issn.0258-8021.2007.02.003
[6] A.U. Rajendra, O. Faust, N. Kannathal, et al. Non-linear analysis of EEG signals at various sleep stages. Computer Methods and Programs in Biomedicine, 2005, 80: 37–45. http://dx.doi.org/10.1016/j.cmpb.2005.06.011
[7] Z. Ji, S.R. Qin. Detection of EEG basic rhythm feature by using band relative intensity ratio (BRIR). 2003 IEEE International Conference on Acoustics, Speech, and Signal Processing. Hong Kong: IEEE, 2003: 429–432. http://dx.doi.org/10.1109/ICASSP.2003.1201710
[8] W. Klimesch. EEG alpha and theta oscillations reflect cognitive and memory performance: A review and analysis. Brain Research Reviews, 1999, 29: 169–195. http://dx.doi.org/10.1016/S0165-0173(98)00056-3
[9] D. Kheira, M. Beladgham. Performance of channel selection used for Multi-class EEG signal classification of motor imagery. Indonesian Journal of Electrical Engineering and Computer Science, 2019, 15: 1305. https://doi.org/10.11591/ijeecs.v15.i3.pp1305-1312
[10] K. Sethi, T. Ramya, H.P. Singh, et al. Stress detection and relief using wearable physiological sensors. Telecommunication Computing Electronics and Control, 2019, 17: 1539. https://doi.org/10.12928/telkomnika.v17i3.9719
[11] F.P. George, I.M. Shaikat, P.S. Ferdawoos Hossain, et al. Recognition of emotional states using EEG signals based on time-frequency analysis and SVM classifier. International Journal of Electrical and Computer Engineering, 2019, 9: 1012. https://doi.org/10.11591/ijece.v9i2.pp1012-1020
[12] A. Murata, A. Uetake, Y. Takasawa. Evaluation of mental fatigue using feature parameter extracted from event-related potential. International Journal of Industrial Ergonomics, 2005, 35: 761–770. https://doi.org/10.1016/j.ergon.2004.12.003
[13] T. Hayashi, Y. Mizuno-Matsumoto, E. Okamoto, et al. Anterior brain activities related to emotional stress. 2008 World Automation Congress. Waikoloa: IEEE, 2008: 1–6. https://ieeexplore.ieee.org/document/4698989/
[14] S.K.L. Lal, A. Craig, P. Boord, et al. Development of an algorithm for an EEG-based driver fatigue countermeasure. Journal of Safety Research, 2003, 34: 321–328. https://doi.org/10.1016/s0022-4375(03)00027-6
[15] S.H. Seo, J.T. Lee. Stress and EEG. Convergence and Hybrid Information Technologies. Croatia: InTech, 2010: 410–426. https://doi.org/10.5772/9651
[16] F. Al-Shargie, M. Kiguchi, N. Badruddin, et al. Mental stress assessment using simultaneous measurement of EEG and fNIRS. Biomedical Optics Express, 2016, 7: 3882–3898. https://doi.org/10.1364/boe.7.003882
[17] Discourse on the development of EEG diagnostics and biofeedback for attention-deficit/hyperactivity disorders. Biofeedback and Self-Regulation, 1991, 16: 201–225. http://dx.doi.org/10.1007/BF01000016
[18] B.T. Jap, S. Lal, P. Fischer, et al. Using EEG spectral components to assess algorithms for detecting fatigue. Expert Systems with Applications, 2009, 36: 2352–2359. http://dx.doi.org/10.1016/j.eswa.2007.12.043
[19] N. Sulaiman, M.N. Taib, S. Lias, et al. EEG-based stress features using spectral centroids technique and k-nearest neighbor classifier. 2011 UkSim 13th International Conference on Computer Modelling and Simulation. Cambridge: IEEE, 2011: 69–74. http://dx.doi.org/10.1109/UKSIM.2011.23
[20] U.M. Al-Saggaf, S.F. Naqvi, M. Moinuddin, et al. Performance evaluation of EEG based mental stress assessment approaches for wearable devices. Frontiers in Neurorobotics, 2022, 15: 819448. https://doi.org/10.3389/fnbot.2021.819448
[21] D. Kamińska, K. Smółka, G. Zwoliński. Detection of mental stress through EEG signal in virtual reality environment. Electronics, 2021, 10: 2840. https://doi.org/10.3390/electronics10222840
[22] J. C, Stam, . Use of non-linear EEG measures to characterize EEG changes during mental activity. Electroencephalography and Clinical Neurophysiology, 1996, 99: 214–224. http://dx.doi.org/10.1016/0013-4694(96)95638-2
[23] P. Karthikeyan, M. Murugappan, S. Yaacob. A study on Mental Arithmetic Task based human stress level classification using Discrete Wavelet Transform. 2012 IEEE Conference on Sustainable Utilization and Development in Engineering and Technology. Kuala Lumpur: IEEE, 2013: 77–81. http://dx.doi.org/10.1109/STUDENT.2012.6408369
[24] X.X. Liu, K. Iwanaga, S. Koda. Circulatory and central nervous system responses to different types of mental stress. Industrial Health, 2011, 49: 265–273. https://doi.org/10.2486/indhealth.ms1272
[25] X.L. Yu, J.B. Zhang. Estimating the cortex and autonomic nervous activity during a mental arithmetic task. Biomedical Signal Processing and Control, 2012, 7: 303–308. https://doi.org/10.1016/j.bspc.2011.06.001
[26] U.R. Acharya, O. Faust, S.V. Sree, et al. Atheromatic™: Symptomatic vs. asymptomatic classification of carotid ultrasound plaque using a combination of HOS, DWT & texture. 2011 Annual International Conference of the IEEE Engineering in Medicine and Biology Society. Boston: IEEE, 2011: 4489–4492. http://dx.doi.org/10.1109/IEMBS.2011.6091113
[27] V.J. Samar, A. Bopardikar, R. Rao, et al. Wavelet analysis of neuroelectric waveforms: A conceptual tutorial. Brain and Language, 1999, 66: 7-60. https://doi.org/10.1006/brln.1998.2024
[28] E.L. Glassman. A wavelet-like filter based on neuron action potentials for analysis of human scalp electroencephalographs. IEEE Transactions on Biomedical Engineering, 2005, 52: 1851–1862. http://dx.doi.org/10.1109/TBME.2005.856277
[29] M.K. Wali, M. Murugappan, B. Ahmmad. Wavelet packet transform based driver distraction level classification using EEG. Mathematical Problems in Engineering, 2013, 2013: 1–10. https://doi.org/10.1155/2013/297587
[30] K.K. Paliwal. Spectral subband centroids as features for speech recognition. 1997 IEEE Workshop on Automatic Speech Recognition and Understanding Proceedings. Santa Barbara: IEEE, 2002: 124–131. http://dx.doi.org/10.1109/ASRU.1997.658996
[31] F. Ayachi, S. Boudaoud, J.F. Grosset, et al. Study of the Muscular Force/HOS Parameters Relationship from the Surface Electromyogram. 15th Nordic-Baltic Conference on Biomedical Engineering and Medical Physics (NBC 2011). Berlin, Heidelberg: Springer, 2011: 187–190. https://doi.org/10.1007/978-3-642-21683-1_47
[32] G. Huang, Q. Zhu, C. Siew. Extreme learning machine: Theory and applications. Neurocomputing, 2006, 70: 489–501. http://dx.doi.org/10.1016/J.NEUCOM.2005.12.126
[33] S.F. Ding, H. Zhao, Y.N. Zhang, et al. Extreme learning machine: Algorithm, theory and applications. Artificial Intelligence Review, 2015, 44: 103–115. http://dx.doi.org/10.1007/s10462-013-9405-z
[34] M.R.Y. Zoshk, M. Azarnoosh. The measurement and processing of EEG signals to evaluate fatigue. IFMBE Proceedings. Berlin, Heidelberg: Springer Berlin Heidelberg, 2010: 258–261. https://doi.org/10.1007/978-3-642-14998-6_66
[35] S.A. Hosseini, M.A. Khalilzadeh, M.B. Naghibi-Sistani, et al. Higher order spectra analysis of EEG signals in emotional stress states. 2010 Second International Conference on Information Technology and Computer Science. Kiev: IEEE, 2010: 60–63. http://dx.doi.org/10.1109/ITCS.2010.21
[36] P.M.Pandiyan, S. Yaacob. Mental stress level classification using eigenvector features and principal component analysis. Communications in Information Science and Management Engineering, 2013, 3: 254–261.
[37] S.M.U. Saeed, S.M. Anwar, M. Majid, et al. Selection of neural oscillatory features for human stress classification with single channel EEG headset. BioMed Research International, 2018, 2018: 1049257. https://doi.org/10.1155/2018/1049257
[38] D. Shon, K. Im, J.H. Park, et al. Emotional stress state detection using genetic algorithm-based feature selection on EEG signals. International Journal of Environmental Research and Public Health, 2018, 15: 2461. https://doi.org/10.3390/ijerph15112461
Copyright© Mousa K. Wali, Rashid Ali Fayadh and Nabil K. Al_shamaa. This is an open-access article distributed under the terms of the Creative Commons Attribution License (CC BY), which permits unrestricted use, distribution, and reproduction in any medium, provided the original author and source are credited.